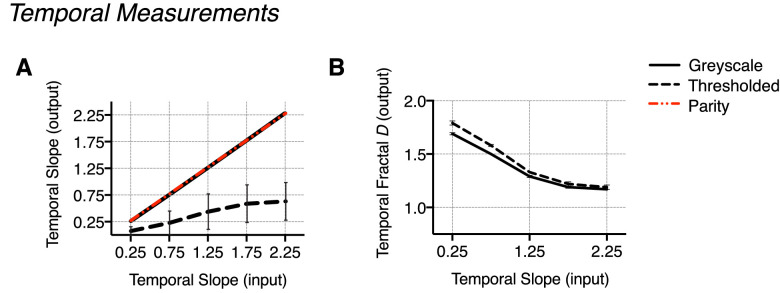
Figure 6.
Measurements in the temporal domain: output 1/fα slope and fractal D values. (A) Output temporal slope averaged across spatial slope, plotted as a function of input temporal slope and displayed against a line of parity (no difference). Similar to the measured output slopes in the spatial domain, output temporal slope conditions are notably different between movie types. (B) Output temporal fractal D values averaged across the spatial slope for each movie type and plotted as a function of temporal slope. (C) Plotting the measured difference for each parameter reveals substantially less difference in measured D between movie types when compared to the range of the difference in measured α, which is particularly large at the higher temporal slope conditions. Error bars indicate the standard error of the mean (no visible error bars indicate the variance to be smaller than the physical size of the data point on the plot).

