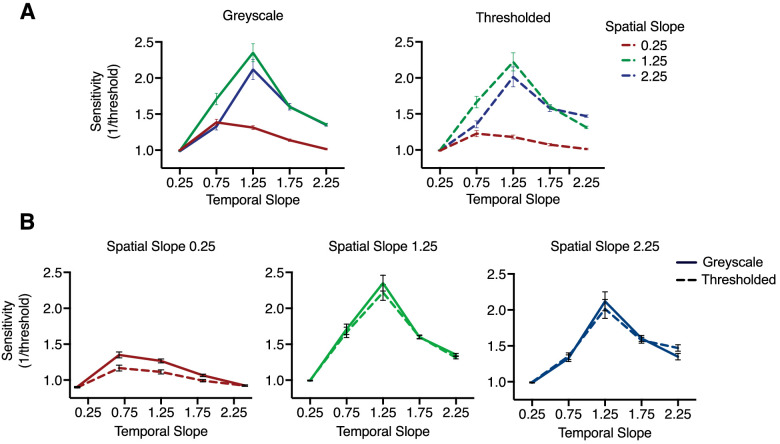
Figure 8.
Sensitivity for each movie type (top) and discrete spatial slope conditions (below). (A) Gray scale (left) and thresholded (right) tuning curves plotted for each spatial slope as a function of temporal slope. The pattern of the response profiles is highly similar for each movie type. (B) Sensitivity toward each spatial slope discretely (from left to right = 0.25, 1.25, 2.25) plotted as a function of the temporal slope. Despite an overall decreased sensitivity toward the spatial slope 0.25, the tuning curves for each spatial slope remain similar, with each peaking for intermediate range spatial slope and temporal slope values. A subtle shift in peak can be seen when the stimuli concur in space and time (e.g., a spatial slope of 1.25 and a temporal slope of 1.25). This shift in peak is less clear toward a spatial slope of 2.25, where the peak sensitivity is observed toward the natural temporal slope of 1.25; however, sensitivity does not drop off, but remains slightly elevated at the steeper temporal slope conditions of 1.75 and 2.25. Error bars indicate standard error of the mean.

