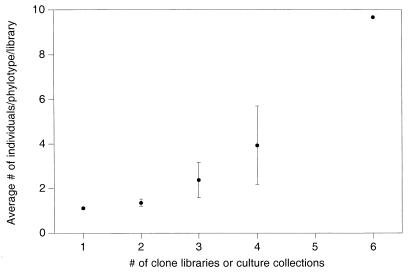
FIG. 3.
Relationship between phylotype abundance and detection frequency for 16S rDNA clone libraries and culture collections. The average abundance of each phylotype was calculated across all eight libraries. Phylotypes were then grouped according to the number of libraries in which each phylotype appeared. The mean phylotype abundance for each group was calculated by using the average abundance values previously calculated for individual phylotypes. Only one phylotype appeared in six libraries. The error bars indicate 95% confidence intervals.

