Figure 6.
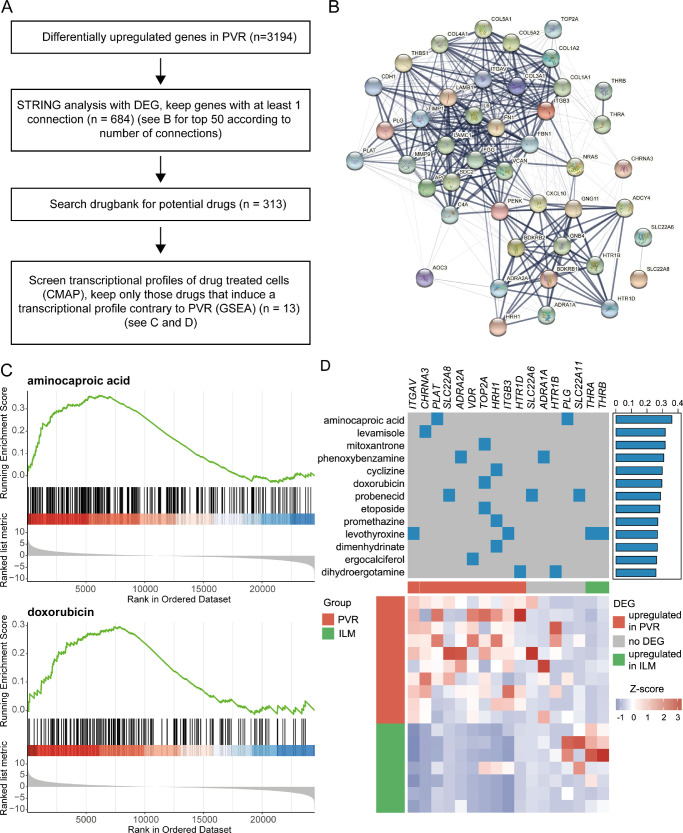
Transcriptome-based drug repurposing. (A) Overview of analysis. (B) String network of the top PVR factors with the highest number of interactions. (C) Enrichment score curves of the Gene Set Enrichment Analysis for two fitting drugs, namely aminocaproic acid and doxorubicin. The ordered data set at the bottom represents the log2 fold change-ranked list of PVR genes. Each gene being downregulated by the respective drug is shown by a vertical black line in the center row of the plot. This visualizes at which position of the PVR-ranked list the drug-regulated genes are located. The more the downregulated genes are located on the left side of the plot in the area of most upregulated PVR genes, the more contrary the drug-induced gene expression profile is in relation to the disease and, therefore, could be a potential treatment option for PVR. The accuracy of fit is quantified by the enrichment score, which is defined by the peak of the green line. (D) Heatmap of most fitting identified drugs. The upper part of the heatmap displays the drugs in the rows and their known targets in the columns, as well as the normalized enrichment score from GSEA to the right. The lower part of the heatmap visualizes the expression of the targets shown above in PVR and control tissue. Each row represents one sample and each column represents one target gene. The z-score represents a gene's expression in relation to its mean expression by standard deviation units (red = upregulation and blue = downregulation).

