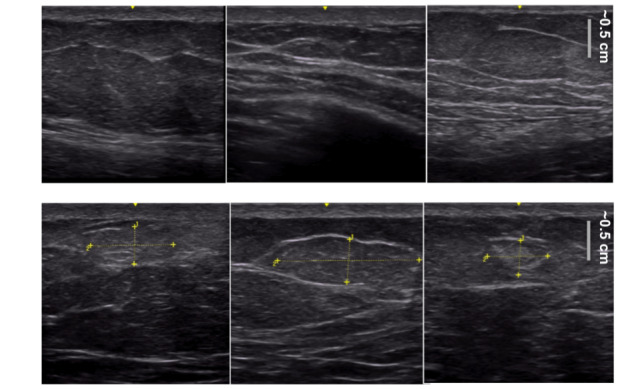
Figure 2.

Some examples of images found in our data set. The top row displays negative images (no lipohypertrophy present) and the bottom row displays positive images (lipohypertrophy present) where the yellow annotations indicate the exact area of the mass. The yellow annotations are only for the reader; the images that the model was trained on were unmarked with no yellow annotations.
