
FIGURE 2.
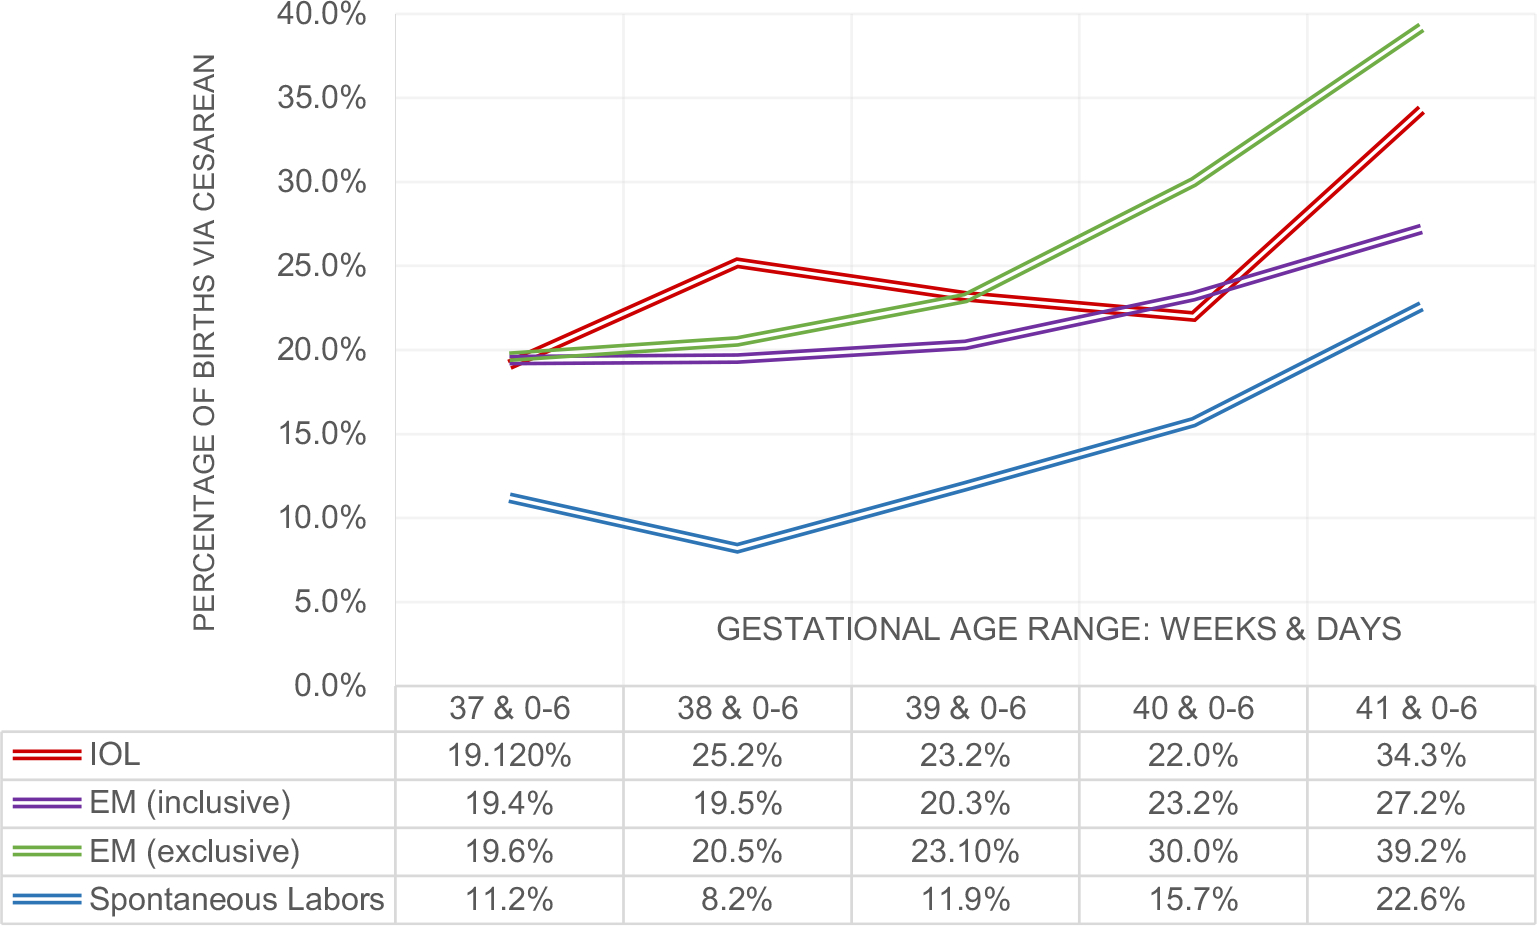
Percentage of cesarean births within each gestational age range and by IOL/EM groups. Cesarean births after spontaneous labors are included in inclusive EM group frequencies and graphed separately in gray
Official websites use .gov
A
.gov website belongs to an official
government organization in the United States.
Secure .gov websites use HTTPS
A lock (
) or https:// means you've safely
connected to the .gov website. Share sensitive
information only on official, secure websites.
Percentage of cesarean births within each gestational age range and by IOL/EM groups. Cesarean births after spontaneous labors are included in inclusive EM group frequencies and graphed separately in gray