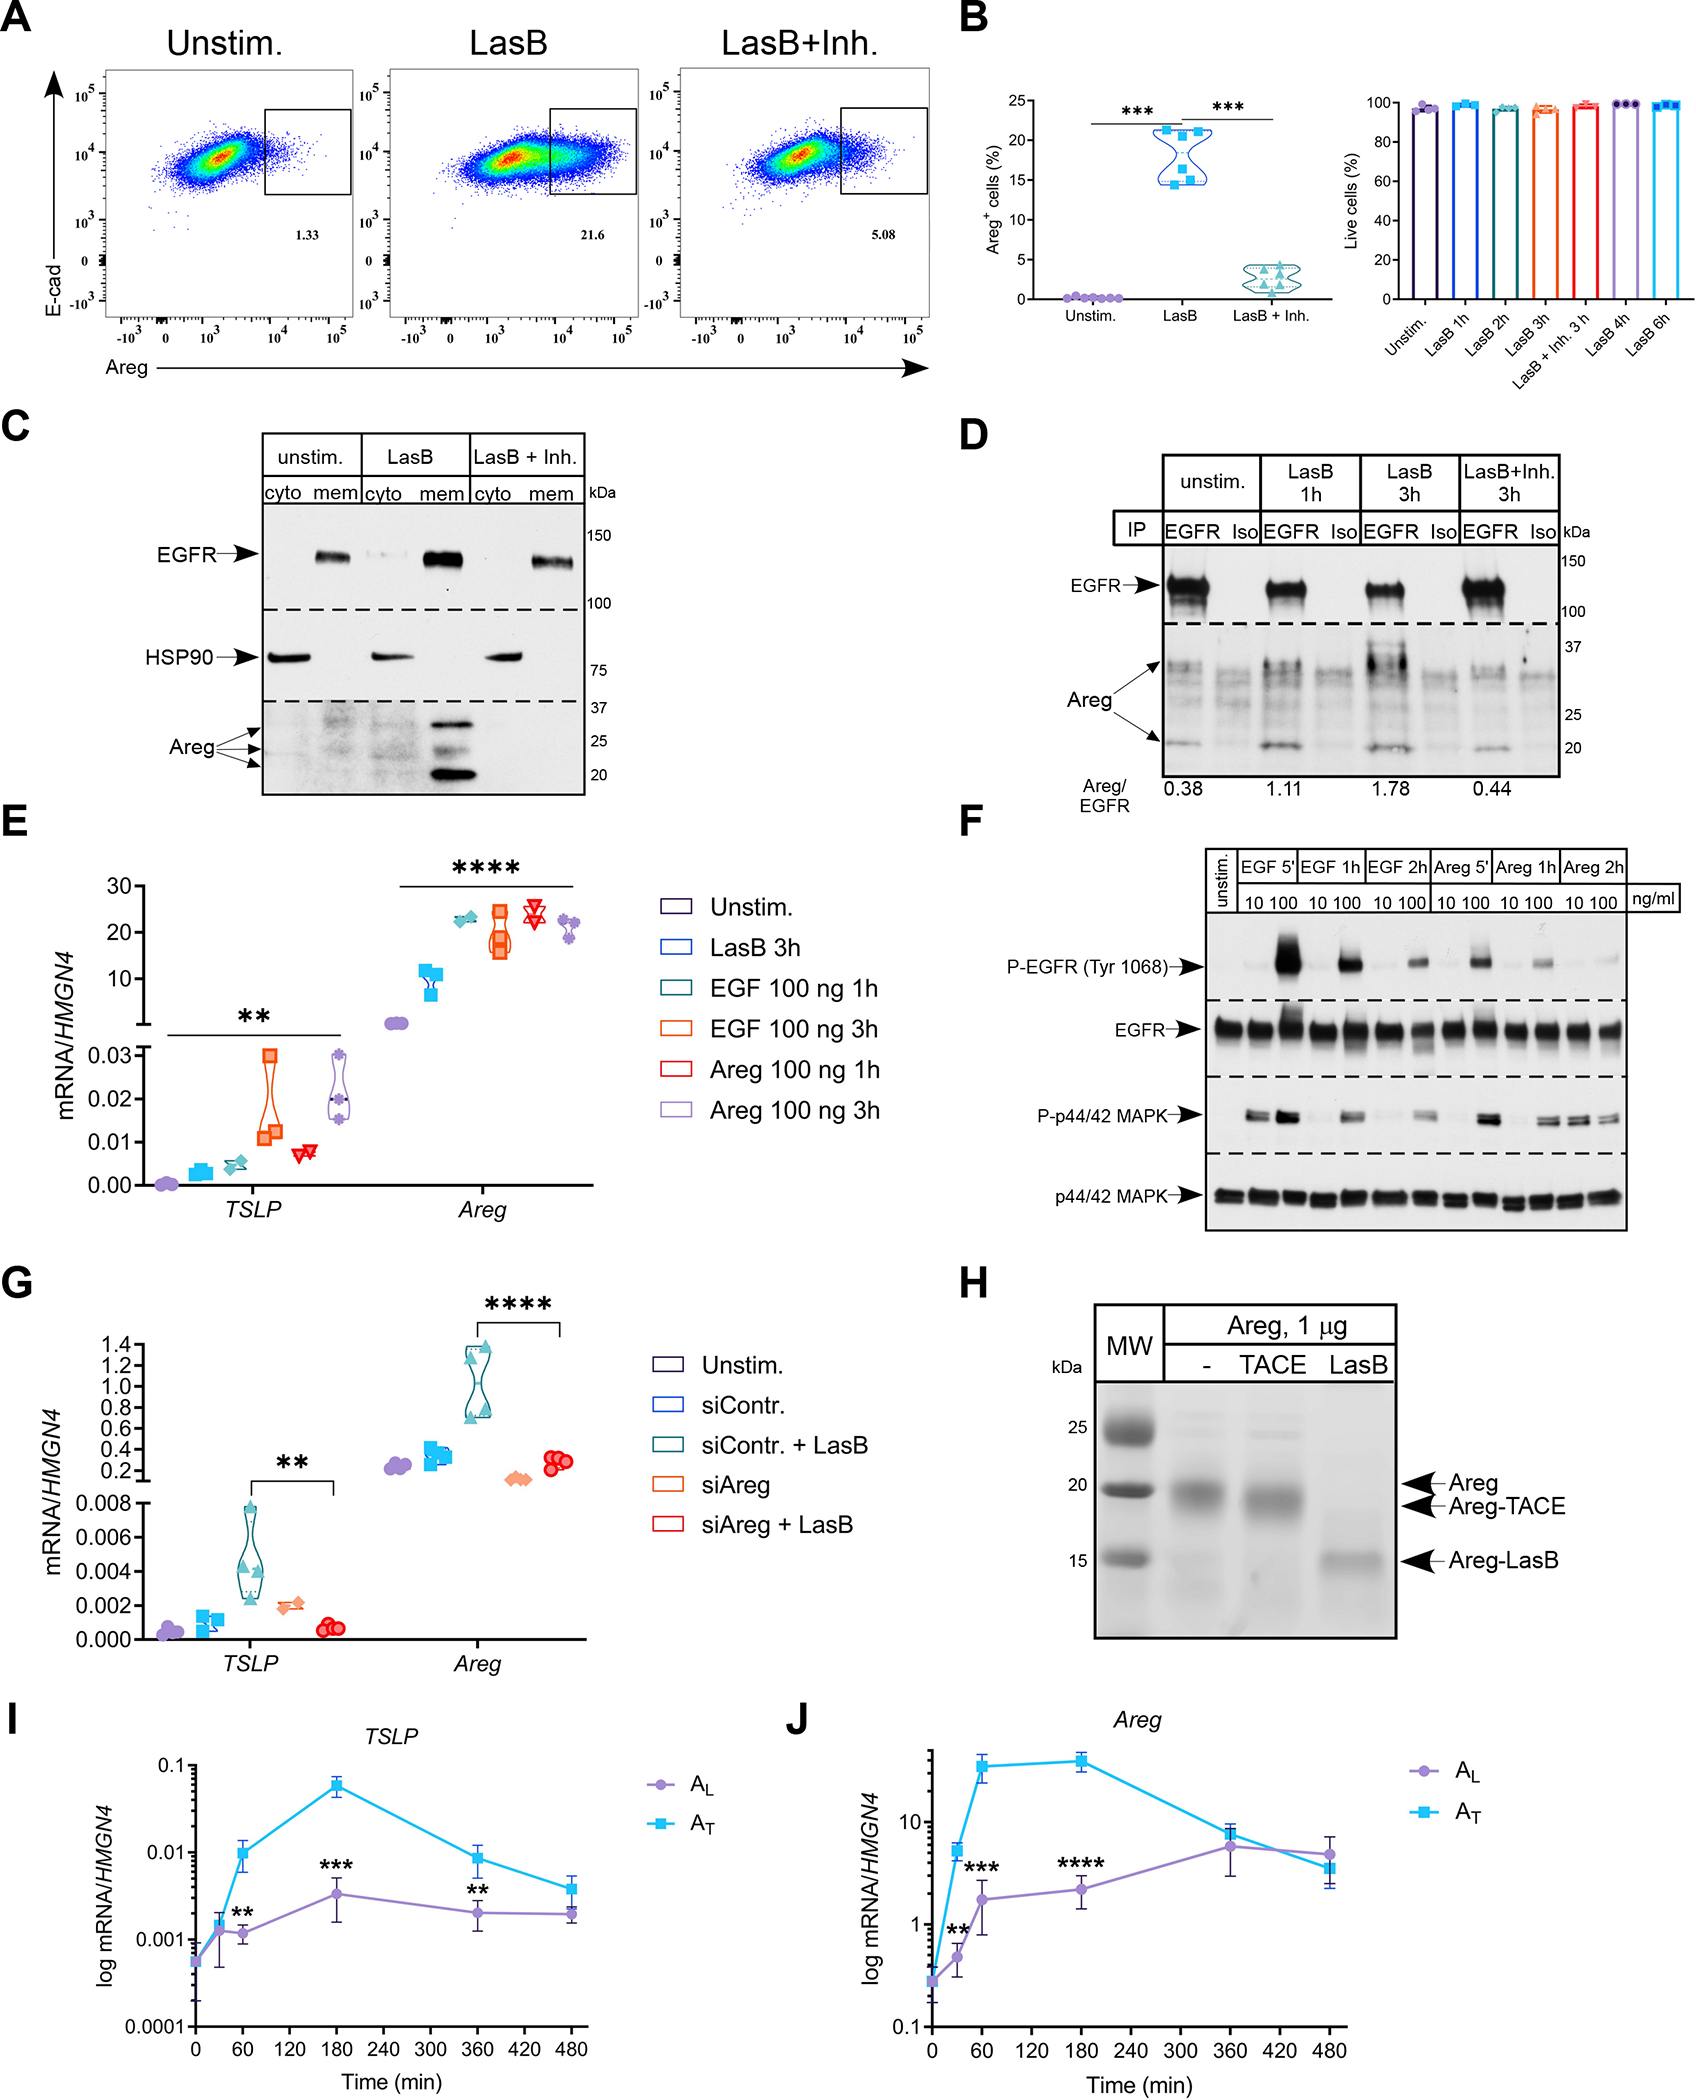
Figure 2. P. aeruginosa toxin utilizes amphiregulin to activate epithelial cells.

(A and B) Representative FACS plots (n=6) of frequency of Areg+ H292 cells (A) stimulated with LasB (2 μg/ml) +/− inhibitor (50 μM) for 3hr and quantification (B) of Areg+ (left) and total live cells (right) (n=3–6).
(C and D) Immunoblot analysis of Areg in cytosolic and membrane fractions (C) and after immunoprecipitation with anti-EGFR antibodies (D) in H292 cells stimulated with LasB (3 μg/ml) +/− inhibitor (50 μM) for 3hr (n=3).
(E) Relative mRNA expression of TSLP and Areg in H292 cells stimulated with LasB (2 μg/ml) for 3hr, EGF and Areg (100 ng/ml) for 1 or 3 hr (n=3).
(F) Immunoblot analysis of P-EGFR Tyr1068 and P-p44/42 MAPK in H292 cells stimulated with EGF and Areg (10 or 100 ng/ml) at indicated time points (n=3).
(G) Relative mRNA expression of TSLP and Areg in H292 cells treated with control or Areg siRNA and stimulated with LasB (5 μg/ml) for 3hr (n=4).
(H) In vitro cleavage of recombinant human Areg (1 μg) by LasB and ADAM17 or TACE (0.5 μg) for 30 min at RT (n=4).
(I and J) Kinetics of relative mRNA expression of TSLP (I) and Areg (J) in H292 cells treated with AL or AT (50 ng/ml) (n=3).
mRNA expression was measured relative to HMGN4. ß-actin, total EGFR and p44/42 MAPK and HSP90 were used as loading controls. n = independent experiments. Data are mean ± SD and were analyzed by one-way ANOVA with Tukey’s multiple comparisons test (B, E, G) or two-tailed unpaired Student’s t test (I, J). *p < 0.05; **p < 0.01; ***p < 0.001; ****p < 0.0001.
See also Figures S1 and S2.
