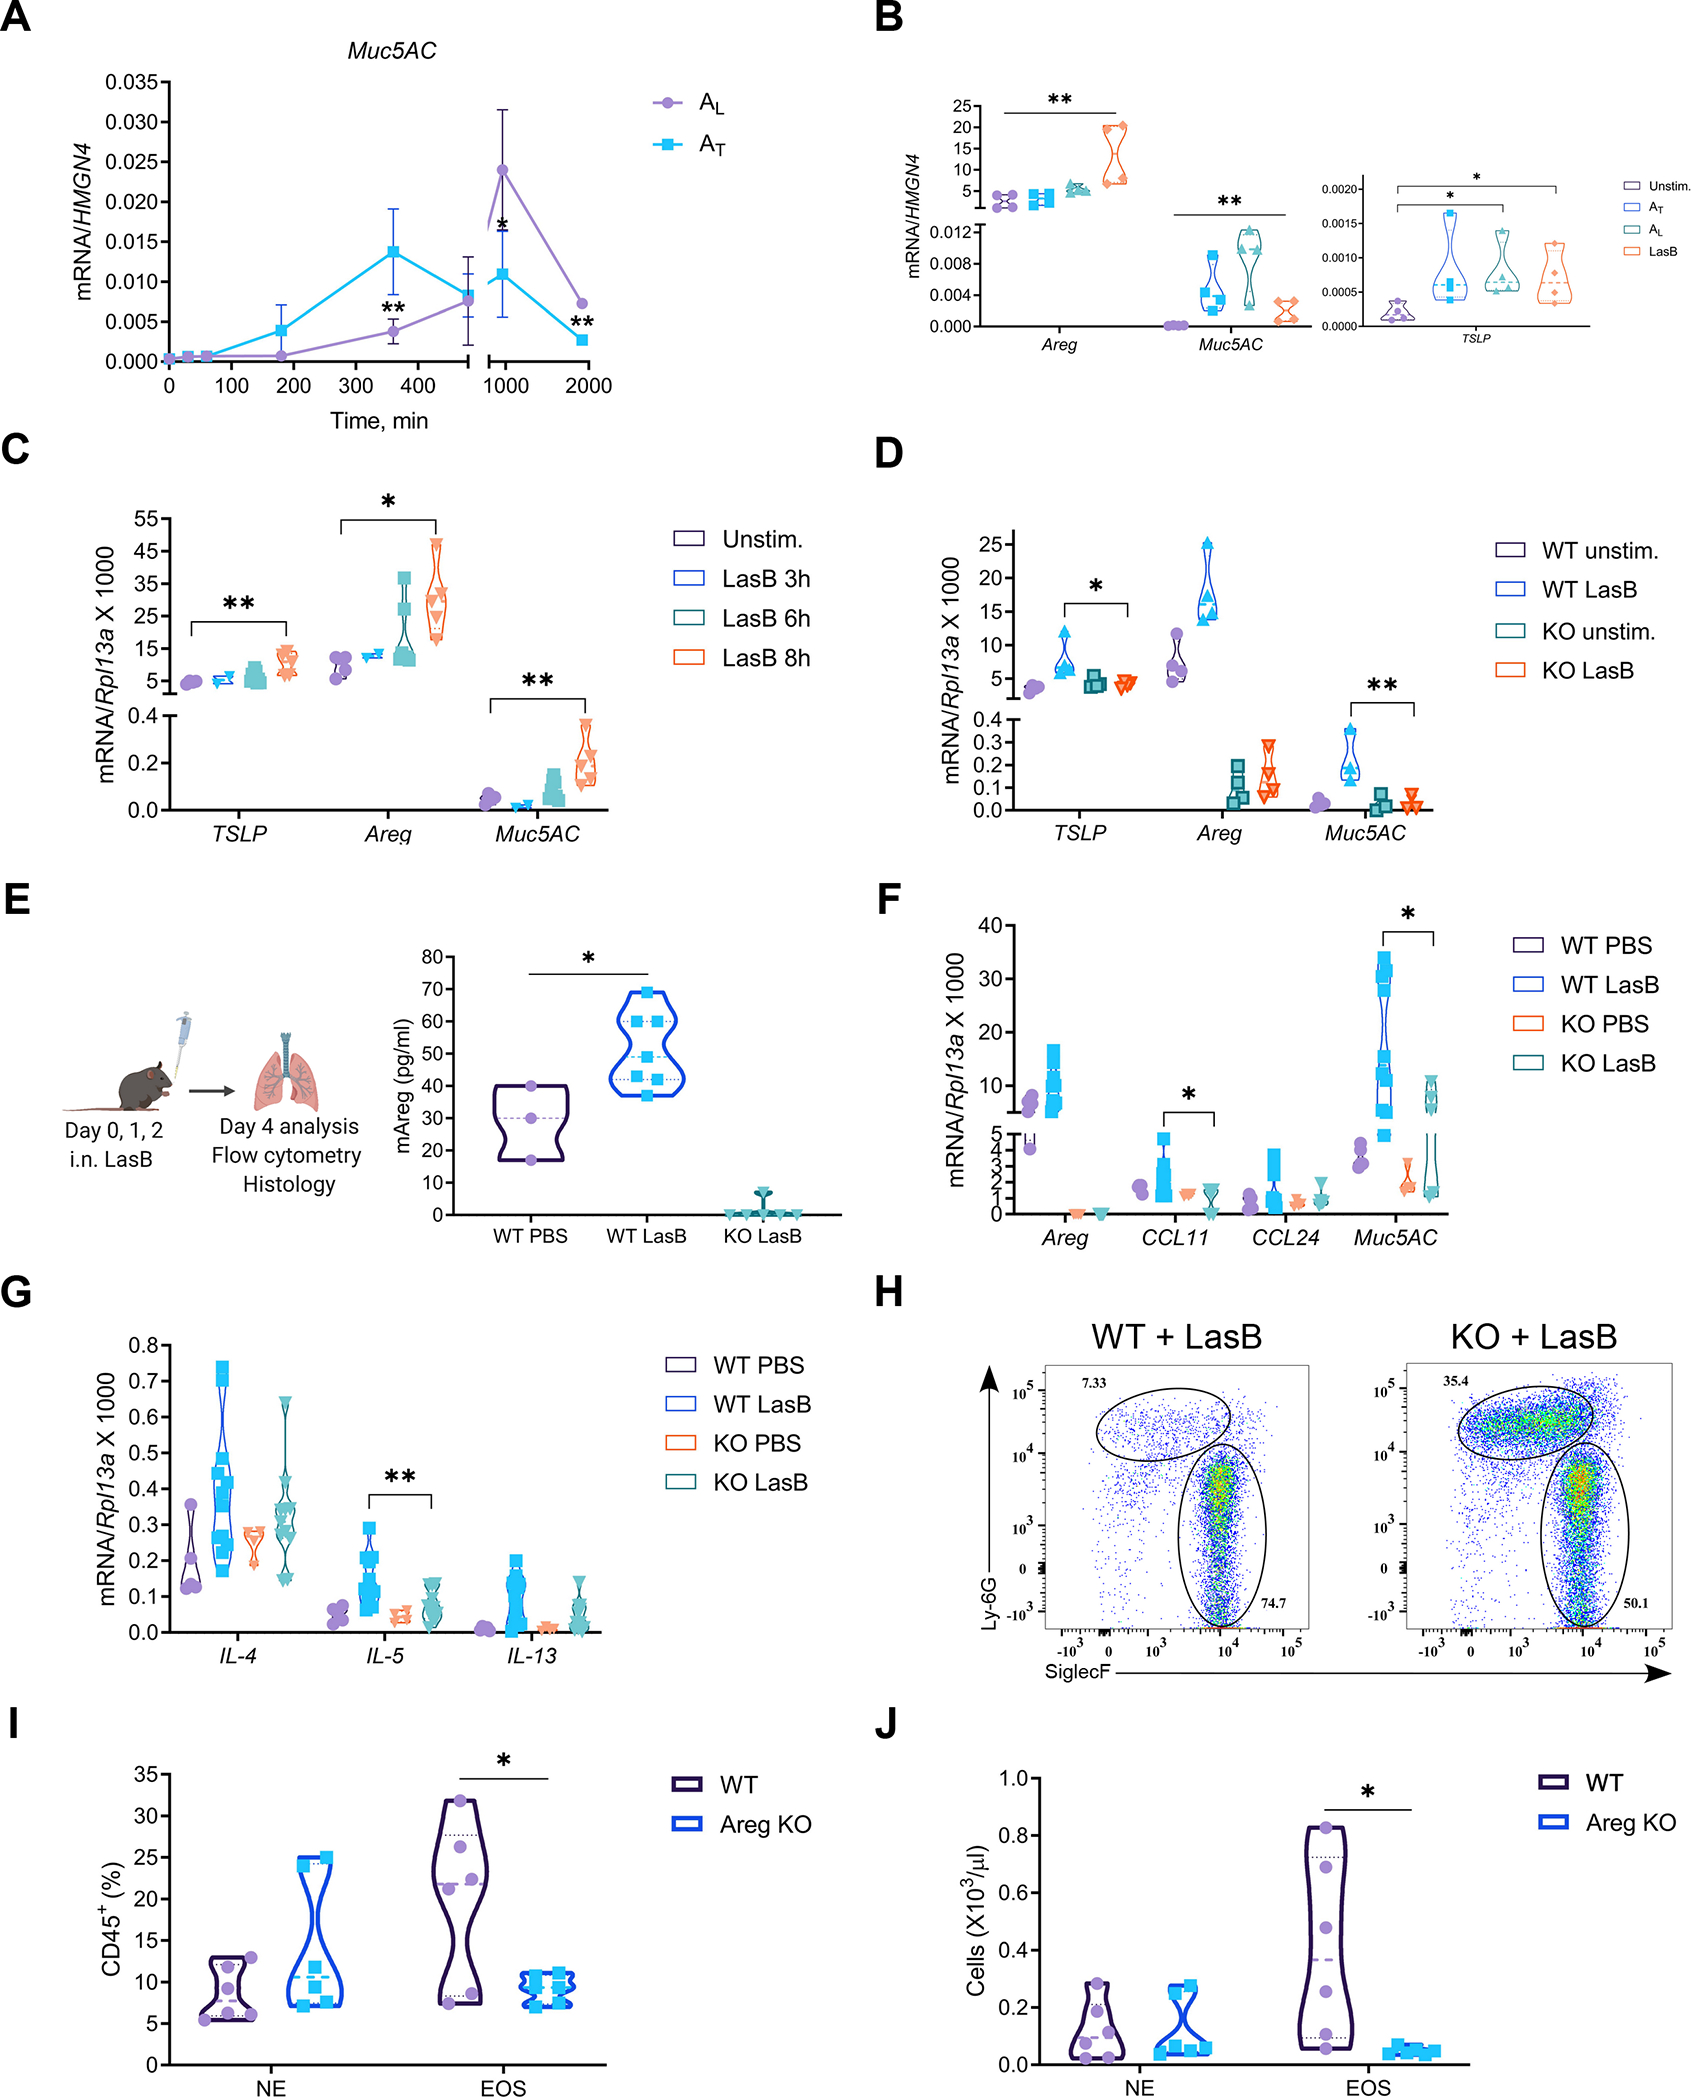
Figure 3. Amphiregulin is required for mucin expression and recruitment of eosinophils.

(A) Kinetics of relative mRNA expression of Muc5AC in H292 cells treated with 50 ng/ml of AL or AT (n=3).
(B) Relative mRNA expression of TSLP, Areg and Muc5AC in H292 cells stimulated with LasB (0.5 μg/ml), AL or AT (50 ng/ml) for 12hr (n=4).
(C) Relative mRNA expression of TSLP, Areg and Muc5AC in ex vivo mouse lung organ cultures stimulated with LasB (5 μg/ml) for indicated times (n=5).
(D) Relative mRNA expression of TSLP, Areg and Muc5AC in WT and Areg−/− (KO) mouse lung organ cultures stimulated with LasB (5 μg/ml) for 8 hr (n=3–4).
(E) (Left) Experimental protocol for the development of innate airway inflammation and (Right) ELISA of Areg concentrations in the BAL of WT and Areg−/− (KO) mice (combined of 3 experiments yielding 3–7 mice per group).
(F and G) Relative mRNA expression of Areg, Ccl11, Ccl24 and Muc5AC (F) and type 2 cytokines (IL-4, 5, 13) (G) in the lungs of LasB-treated WT and Areg−/− (KO) mice (combined of 3 experiments yielding 4–12 mice per group).
(H-J) Representative FACS plots (n=5) (H) and graphs showing cell frequency (I) and numbers (J) of eosinophils (CD45+MHCII–?CD11b+Siglec-F+) and neutrophils (CD45+MHCII–CD11b+Ly6G+) out of CD45+ cells in the BAL of LasB-treated WT and Areg−/− (KO) mice (combined of 2 experiments yielding 6 mice per group).
mRNA expression was measured relative to HMGN4 in H292 or Rpl13a in mouse lung organ cultures/lungs. n = independent experiments. Data are mean ± SD and were analyzed by two-tailed unpaired Student’s t test (A, I, J) or one-way ANOVA with Tukey’s multiple comparisons test (B-G). *p < 0.05; **p < 0.01; ***p < 0.001.
