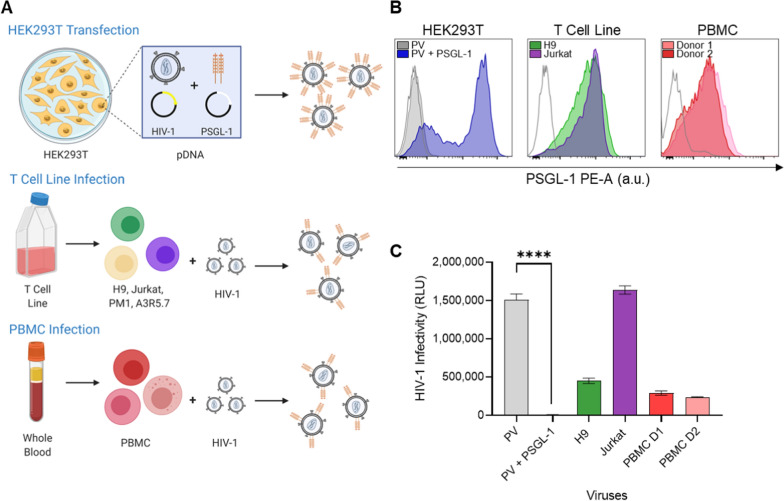
Fig. 1.
Comparison of PSGL-1 cell surface expression and virus infectivity across model systems. A Schematic depicting the three model systems (HEK293T transfection, T cell line infection, PBMC infection) used to produce virus with various amounts of PSGL-1 in the manuscript. B Cell surface expression of PSGL-1 on HEK293T cells 48 h after co-transfection with HIV-1 pseudovirus constructs alone (PV; grey histogram), or with pseudovirus constructs and 250 ng of a vector encoding PSGL-1 (PV + PSGL-1, blue histogram). Endogenous levels of PSGL-1 detected by cell surface staining and flow cytometry analysis on the T cell lines, H9 (green) and Jurkat (purple), or activated peripheral blood mononuclear cells (PBMC) from two different donors (red and pink histograms) used for HIV-1 propgation. Isotype staining is shown with unshaded histograms. C Viruses produced in the transfected HEK293T cells or HIV IIIB-infected T cell lines and PBMC from B were normalized for equal viral p24 input in TZM-bl cell cultures. After 48 h the level of infectivity was measured using luminescence readout (relative light units; RLU). Results displayed are the merged mean ± SEM of three independent experiments with each condition tested in duplicate wells. P values were determined using an unpaired t test (****P < 0.0001)

