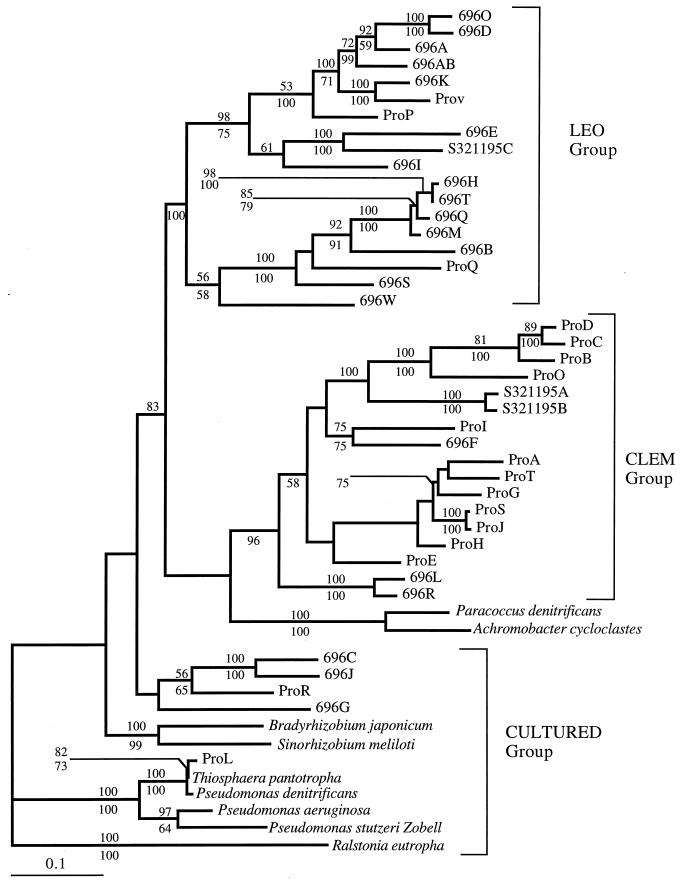
FIG. 2.
Phylogenetic tree of 49 nosZ genes from different species of denitrifiers. The tree was generated by using the maximum likelihood method, based on the alignment of 1,053 bp of the nosZ gene fragments. The best topology was chosen by using the maximum likelihood “loop” algorithm. Bootstrap values (percentages of 100 bootstraps) for maximum likelihood are indicated above the line, and those for neighbor joining analyses are indicated below the line. Only values greater than 50% are shown. The bar labeled 0.1 represents 10% sequence divergence.

