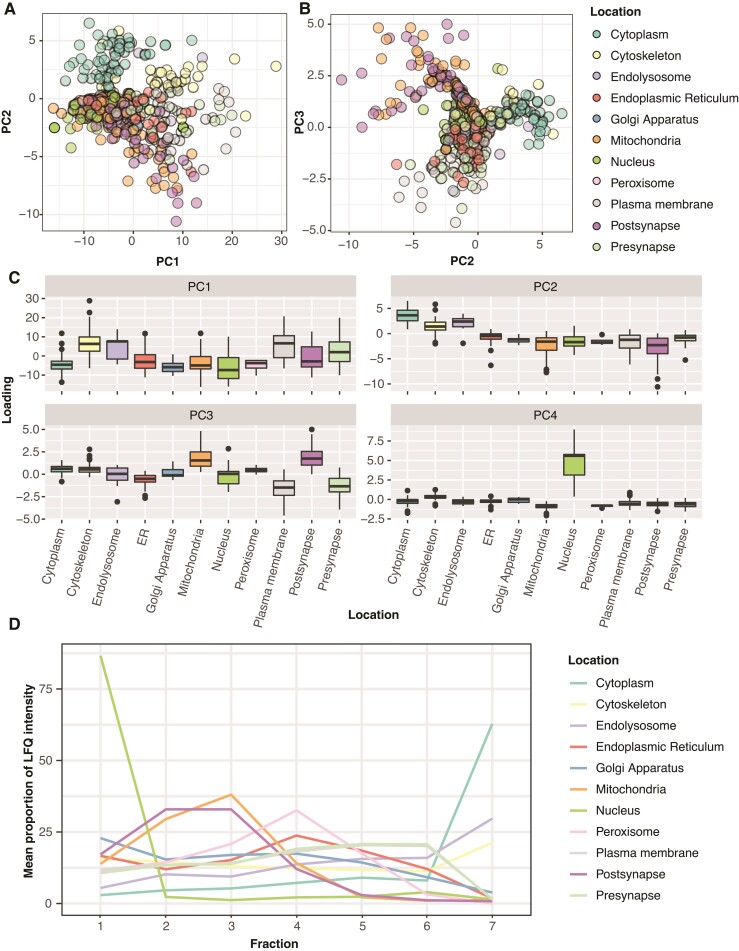
Figure 2.
Established markers proteins segregate according to reproducible patterns across fractions. (A) Marker proteins plotted according to their locations along PC1 and PC2. Supplementary Figure 4 shows a faceted plot of each set of organellar markers alone, to inspect proteins in the crowded central region of the plot. The combination of PCs 1 and 2 shows good separation for cytoskeletal and cytosolic proteins in the lower part of PC2, and mitochondrial and post-synaptic proteins in the top half. (B) PC plot of PCs 2 and 3. PC3 nicely separates post-synaptic and mitochondrial proteins from pre-synaptic and plasma membrane proteins. (C) Box plots show the association of marker proteins from each organelle with the top 4 principal components. PC4 separates the nuclear markers from all other organelles. (D) Line plot of the average proportional distribution profile of the marker set for each organelle.

