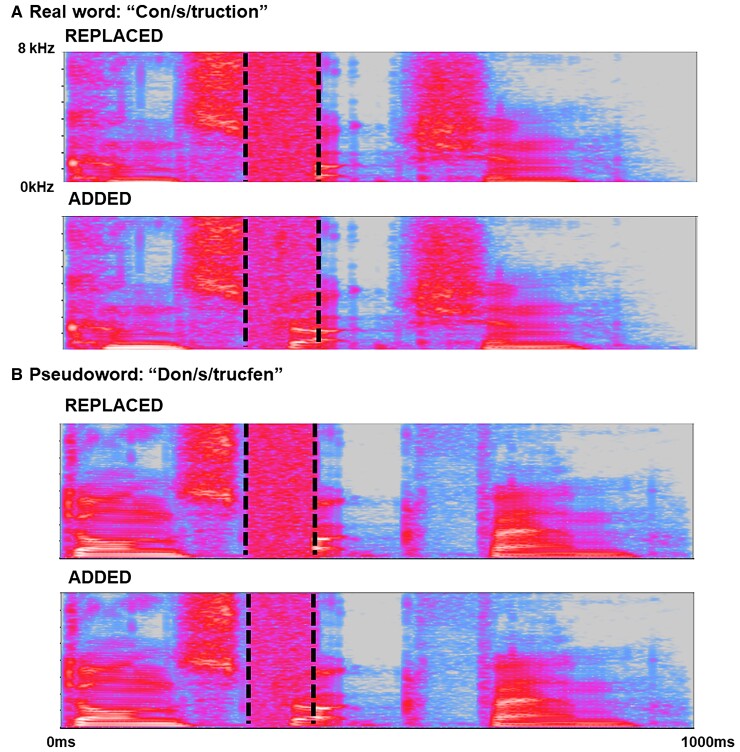
Figure 1.
Representative time–frequency spectrograms of stimuli for the different experimental conditions based on word carriers. The y-axis of each spectrogram codes frequency (kilohertz); the x-axis codes time (milliseconds). In all example spectrograms, vertical dotted lines show the boundaries of the critical (target) spoken phoneme (indicated in the word heading each panel); the spoken word segment containing the target phoneme has been manipulated in each case with white noise. (A) Example stimuli based on real word carriers; (B) stimuli based on pseudoword carriers. In each panel, an example of a ‘Replaced’ stimulus (i.e. white noise replacing the spoken consonant) is shown above and an example of an ‘Added’ stimulus (i.e. white noise superimposed over the spoken consonant) is shown below. Spectrograms were generated in Audacity v 3.0.0 (https://audacityteam.org).

