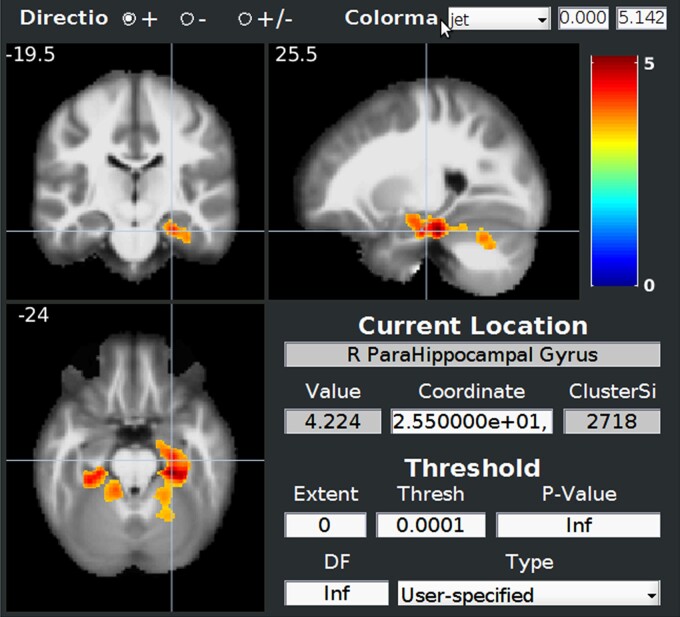
Figure 4.
Comparison of MRI segmentation of GM between 18 DM1 patients and 18 controls showing mostly parahippocampus involvement. Normalized data were smoothed with an isotropic Gaussian kernel of 8 mm. Statistical analysis was performed using a general linear model with age, sex and total intracranial volume as covariates. Statistics were corrected for multiple comparisons with FWE correction at the cluster level with a height threshold of 0.001. The statistical map is showed through BSPM view.

