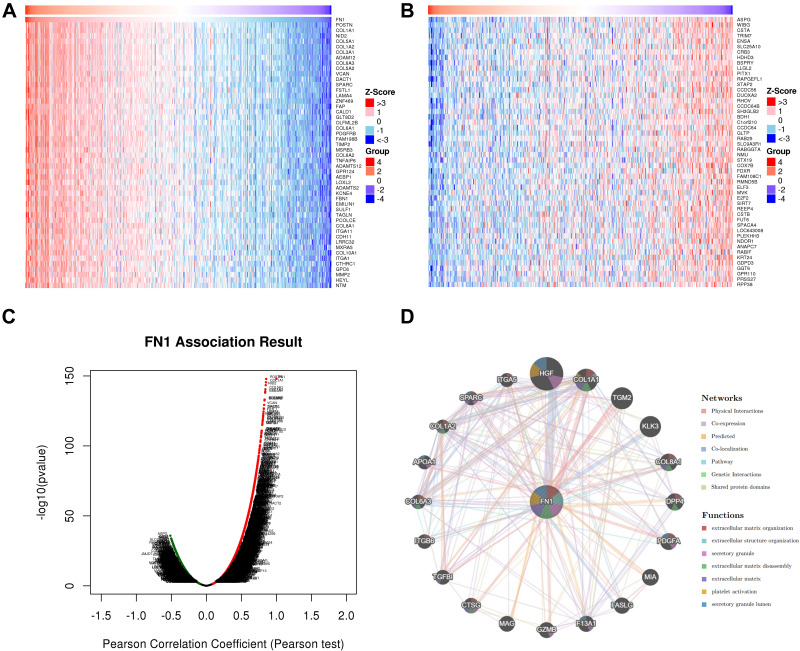
Figure 5.
FN1 co-expression network in HNSCC. (A) Heatmap of top 50 genes positively related to FN1 in HNSCC. (B) Heatmap of top 50 genes negatively related to FN1 in HNSCC. (C) Volcano plot of whole significantly associated genes with FN1 distinguished by Pearson test in HNSCC. (D) PPI network of FN1 using GeneMANIA. Different colors of the network edge indicate the bioinformatics methods applied. Different colors for the network nodes indicate the biological functions of the set of enrichment genes. The top 7 most significant functions were displayed.

