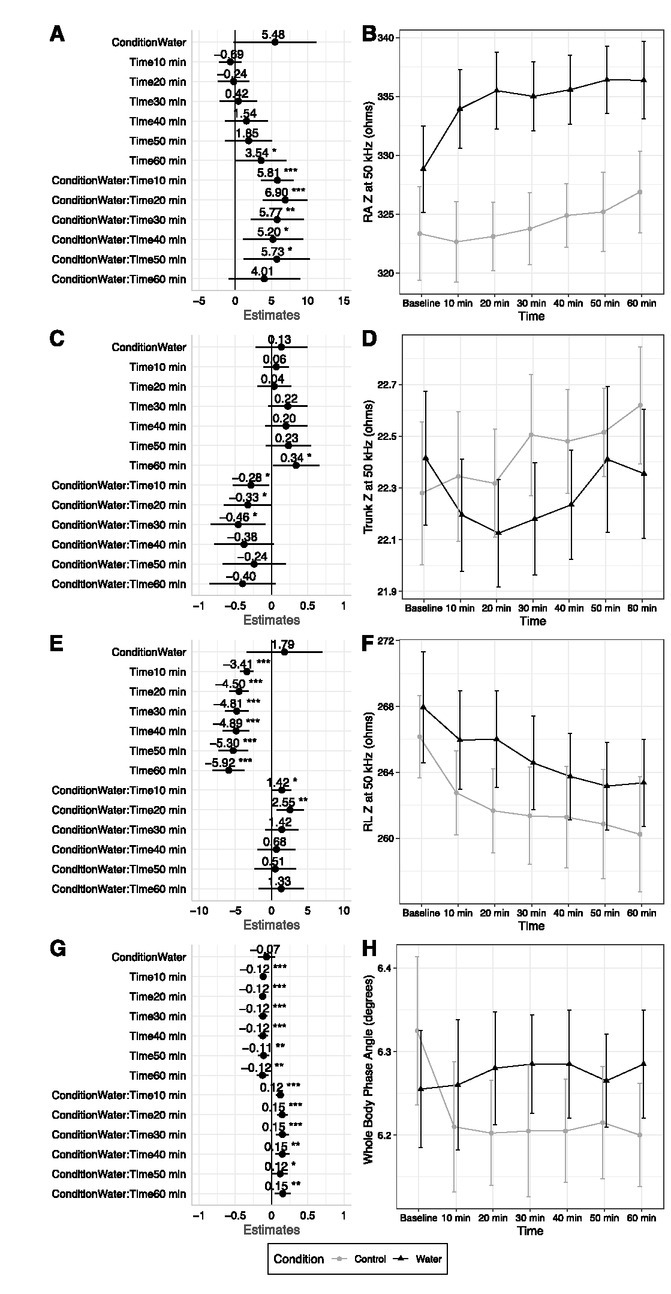
Fig.2.

Raw Bioimpedance at 50 kHz. Changes between baseline and subsequent time points are displayed for right arm impedance at the 50 kHz measurement frequency (A – B), trunk impedance at the 50 kHz measurement frequency (C – D), right leg impedance at the 50 kHz measurement frequency (E – F), and whole body phase angle at the 50 kHz frequency (G – H). Linear mixed model coefficients (b) and their 95% confidence intervals are displayed in panels A, C, E, and G. For all models, the reference groups were control (i.e., no water consumption) for condition and the baseline assessment for time. * indicates p ≤ 0.05; ** indicates p ≤ 0.01; *** indicates p ≤ 0.001.
