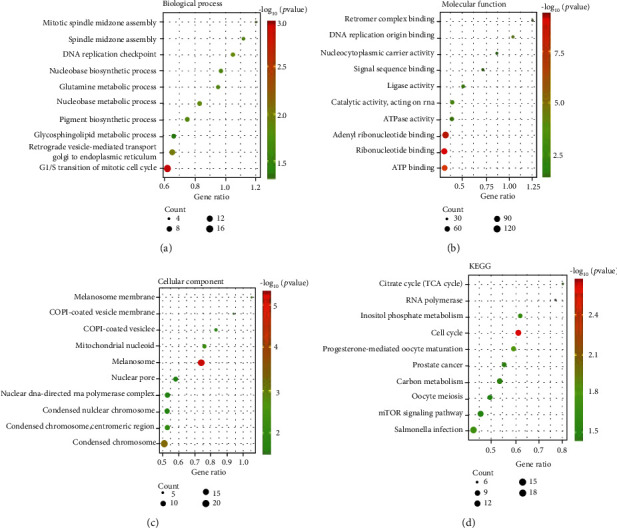
Figure 9.

GO and KEGG pathway analysis of SLC25A13 coexpressed genes. (a) Biological process analysis of SLC25A13 coexpressed genes. (b) Molecular function analysis of SLC25A13 coexpressed genes. (c) Cell component analysis of SLC25A13 coexpressed genes. (d) KEGG pathway analysis of SLC25A13 coexpressed genes.
