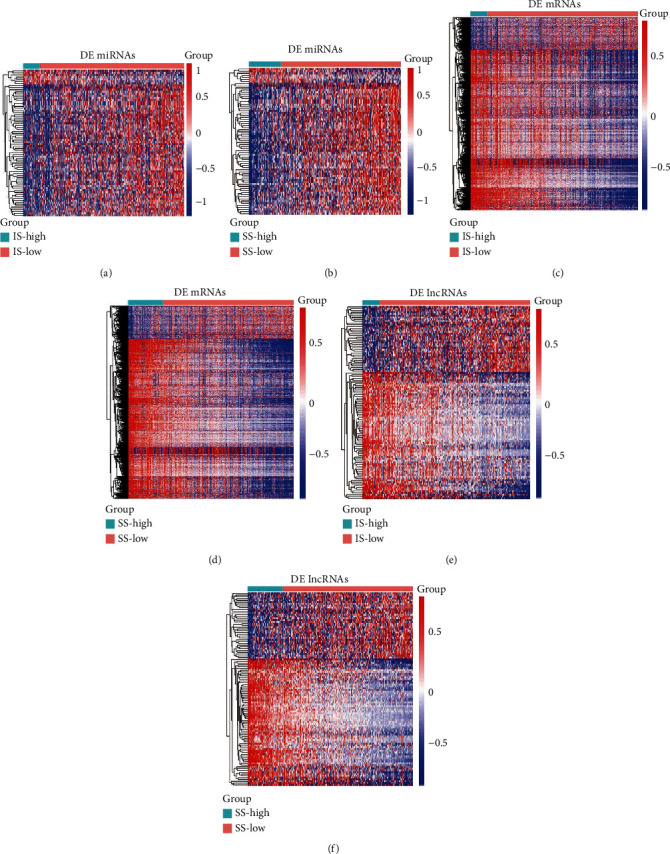
Figure 3.

Expression profiles of stromal and immune score-related differentially expressed genes (DEGs). (a, c, e) Heatmap of differentially expressed miRNAs, mRNAs, and lncRNAs between the high and low immune groups. (b, d, f) Heatmap of differentially expressed miRNAs, mRNAs, and lncRNAs between the high and low stromal groups. The left vertical axis presents the DEG clusters. The horizontal axis represents the samples. The blue color represents downregulated genes, and the red color represents upregulated genes.
