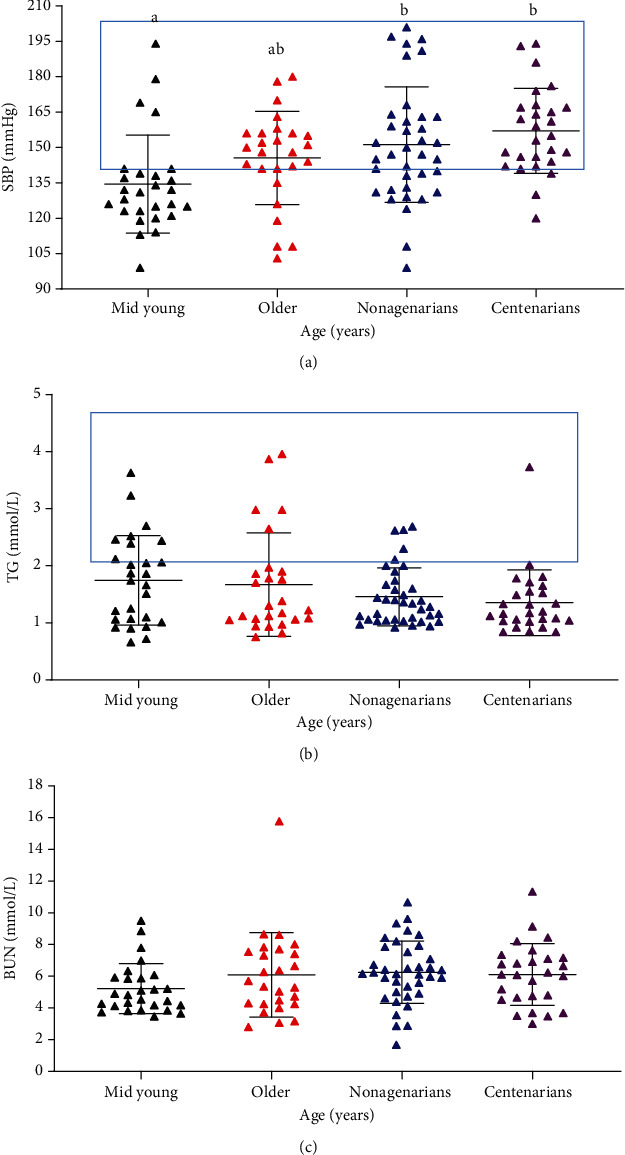
Figure 2.

Scatter plot of individual systolic blood pressure (SBP), triglycerides (TGs), and blood urea nitrogen (BUN) values in various age groups. (a) SBP: the SBP values increased with age (mean ± SD: 134 ± 21, 146 ± 20, 151 ± 24, and 157 ± 18 mmHg in Mid young, Older, Nonagenarians, and Centenarians, respectively; p < 0.001). The box represents a group of subjects with values outside the normal range. Different letters represent significant differences, and the same letters represent nonsignificant differences. (b) TG: no significant difference in TG values was found among the groups (mean ± SD: 1.74 ± 0.78, 1.67 ± 0.91, 1.46 ± 0.51, and 1.35 ± 0.58 mmol/L in Mid young, Older, Nonagenarians, and Centenarians, respectively; p = 0.04). (c) BUN: the concentration of BUN increased with age (mean ± SD: 5.21 ± 1.58, 6.08 ± 2.66, 6.24 ± 1.97, and 6.11 ± 1.95 mmol/L in Mid young, Older, Nonagenarians, and Centenarians, respectively; p = 0.046).
