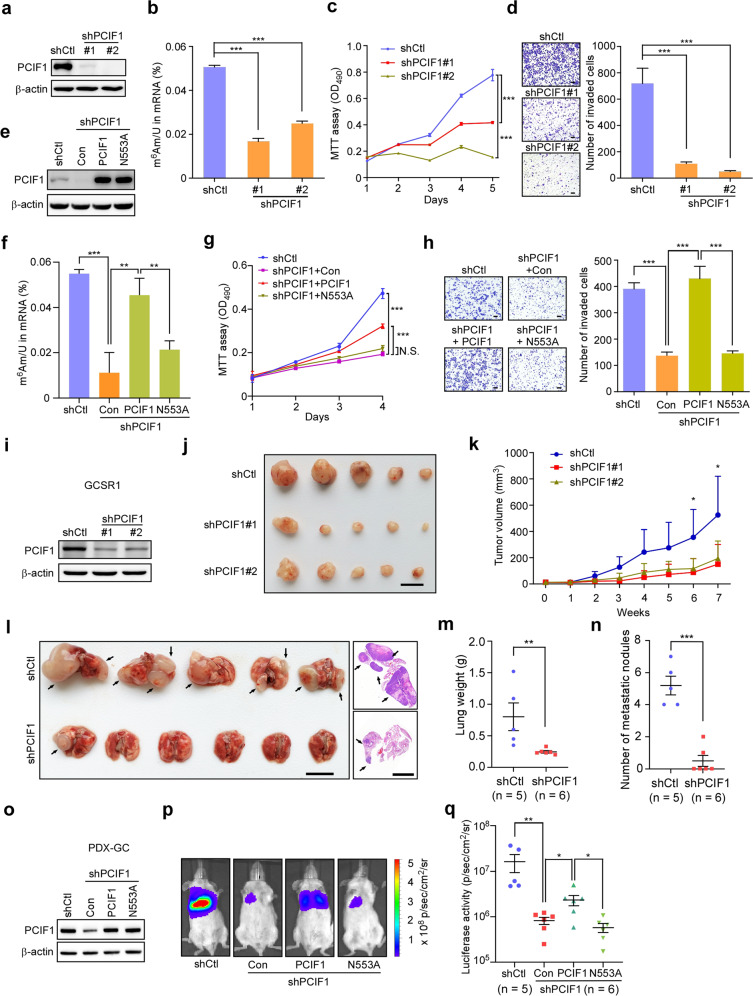
Fig. 2. Knockdown of PCIF1 inhibits the aggressiveness of gastric cancer cells.
a Confirmation of PCIF1 knockdown in AGS cells with two independent lentivirus-based PCIF1 shRNAs by western blot analysis. b LC-MS/MS quantification of the m6Am/U ratios of mRNAs in control and PCIF1-depleted AGS cells. c MTT assays of AGS cells with control or PCIF1 shRNAs. d Migration analysis of AGS cells with control or PCIF1 shRNAs. Representative images of invaded cells are shown. The invaded cells were counted. Scale bars, 100 μm. e Western blot analysis of PCIF1 expression in control AGS cells, PCIF1-depleted cells, and PCIF1-depleted cells transfected with wild-type or mutant PCIF1 (N553A) plasmid. f LC-MS/MS quantification of the m6Am/U ratios of mRNAs in AGS cells with the indicated treatments. g MTT assays of AGS cells with the indicated shRNA and plasmids. h Migration analysis of AGS cells with the indicated shRNAs and plasmids. Representative images of invaded cells are presented. The invaded cells were quantified. Scale bars, 100 μm. i Confirmation of PCIF1 depletion in GCSR1 cells with lentivirus-based control or PCIF1 shRNAs by western blotting. j, k Control and PCIF1-depleted GCSR1 cells were subcutaneously injected into BALB/C nude mice. The tumor volume was measured every week, and the growth curves are shown. The images of tumors in each group are presented (n = 5). Scale bar, 1 cm. l–n Control and PCIF1-knockdown GCSR1 cells were intravenously injected into SCID mice and lung metastases (black arrows) were measured. The lung was weighted at the end of experiment. Gross lung and representative H&E images are presented (l). Statistics analyses of lung weight (m) and metastatic nodule number (n) are shown. Scale bars, 1 cm. o–q PDX-GC cells stably expressed a luciferase reporter gene were infected by lentivirus-based shRNA targeting PCIF1, and then overexpressed with wild-type PCIF1 or its catalytically inactive N553A mutant. Western blotting with the indicated antibodies is shown (o). These PDX-GC cells were intravenously injected into SCID mice. Representative bioluminescence images are also presented (p). Quantification analyses of bioluminescent images of lung metastases are shown (q). Data are expressed as means ± SD. *P < 0.05, **P < 0.01, ***P < 0.001, Student’s t-test (b–d, f–h, k), Mann–Whitney test (m, n, q).

