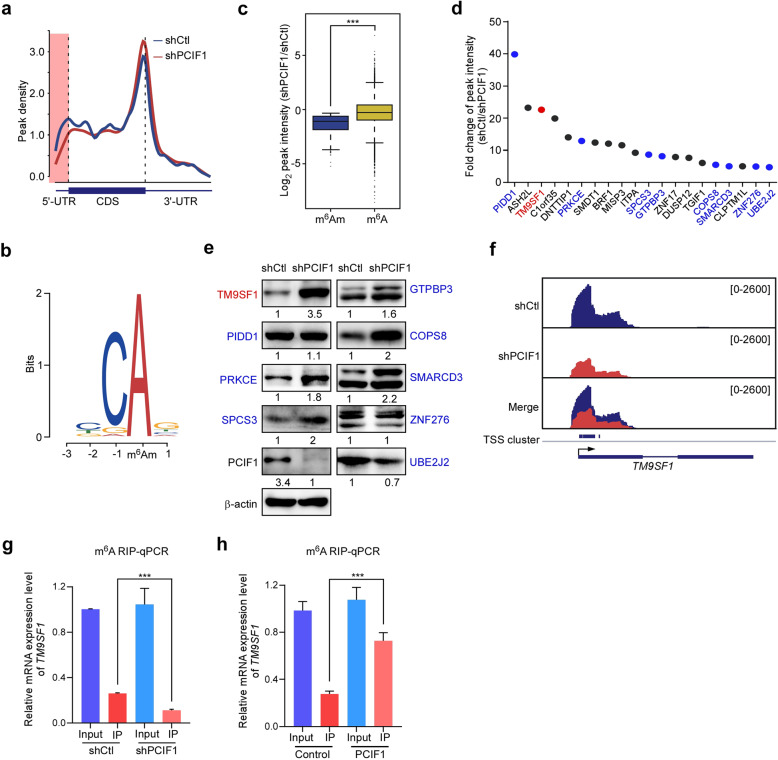
Fig. 3. Identification of TM9SF1 as a target mRNA of PCIF1.
a–c Transcriptome-wide m6A-seq analyses of control or PCIF1-depleted AGS cells. Distribution of m6A/m6Am peaks across mRNA segments in AGS cells (a). Each segment was normalized according to its average length by RefSeq annotation. Motif analysis of m6Am peaks of mRNAs modified by PCIF1 in AGS cells (b). BCA, A = m6Am; B = C, G, or U. E-value = 4.5e−54. Boxplot analysis of change of m6A/m6Am peaks intensity in AGS cells upon PCIF1 knockdown is shown (c). d m6A-Seq analysis of top 20 down-regulated genes in m6Am abundance in AGS cells. The data are presented by the fold change of peak intensity (shControl/shPCIF1). ASH2L ASH2 (absent, small, or homeotic)-like, BRF1 BRF1 RNA polymerase III transcription initiation factor subunit, C1orf35 chromosome 1 open reading frame 35, CLPTM1L CLPTM1 (cleft lip and palate transmembrane protein 1)-like, COPS8 COP9 signalosome subunit 8, DNTTIP1 deoxynucleotidyltransferase terminal interacting protein 1, DUSP12 dual specificity phosphatase 12, GTPBP3 GTP binding protein 3, mitochondrial; ITPA inosine triphosphatase, MISP3 MISP family member 3, PIDD1 p53-induced death domain protein 1, PRKCE protein kinase C epsilon, SMARCD3 SWI/SNF related, matrix associated, actin dependent regulator of chromatin, subfamily d, member 3, SMDT1 single-pass membrane protein with aspartate rich tail 1, SPCS3 signal peptidase complex subunit 3, TGIF1 TGFB induced factor homeobox 1, TM9SF1 transmembrane 9 superfamily member 1, UBE2J2 ubiquitin conjugating enzyme E2 J2, ZNF17 zinc finger protein 17, ZNF276 zinc finger protein 276. e Western analysis of the potential target genes of PCIF1 predicted by m6A-Seq and Kaplan–Meier survival curves (Supplementary Fig. S4) in control and PCIF1-depleted AGS cells. And intensities of PCIF1 potential target genes in PCIF1-depleted cells compared to those in control cells are shown. f The analysis of m6A/m6Am peaks on TM9SF1 gene in control and PCIF1-depleted AGS cells. g, h m6A-RIP analysis of TM9SF1 mRNA in AGS cells transfected with the indicated shRNA and plasmids. The enrichment of TM9SF1 mRNA in immunoprecipitation (IP) or input fraction was determined by qRT-PCR. Data are shown as means ± SD. N.S. means not significant; ***P < 0.001, Student’s t-test.

