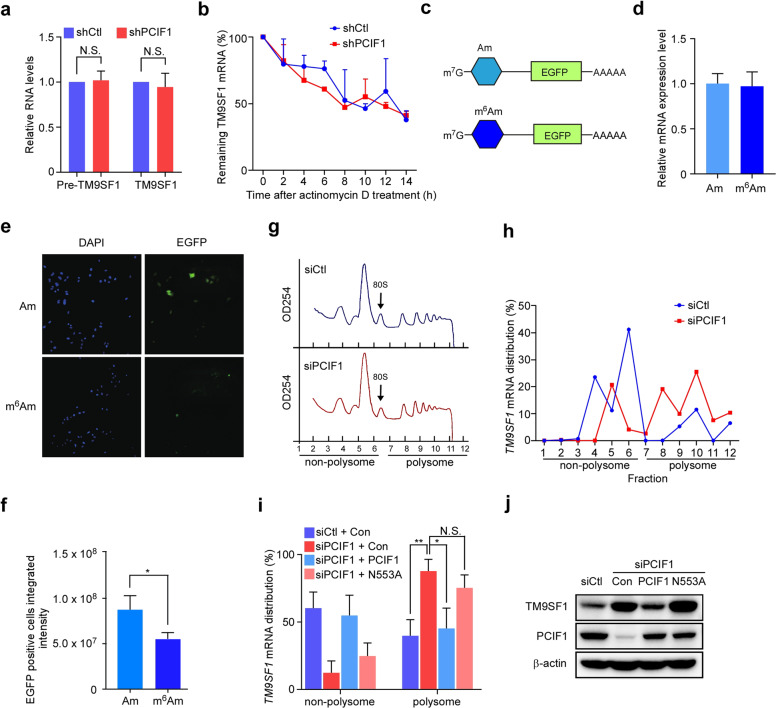
Fig. 4. m6Am modification suppresses TM9SF1 mRNA translation.
a Quantitative RT-PCR analysis of precursor or mature TM9SF1 mRNA expression in AGS cells with control or PCIF1 depletion. Data are presented as log2 value of PCIF1 relative to GAPDH. b Analysis of remaining TM9SF1 mRNA at the indicated times in control and PCIF1-depleted AGS cells after actinomycin D treatment. c–f The expression of m7G-Am or m7G-m6Am EGFP mRNA in Hela cells. EGFP mRNA that starts with either m7G-Am or m7G-m6Am modification was generated by in vitro transcription (c). Cells were transfected with m7G-Am or m7G-m6Am EGFP mRNA and subjected to qRT-PCR (d) and fluorescence microscopy (e). Representative images of EGFP in cells are shown. Fluorescence intensity of EGFP-positive Hela cells was quantified (f). DNA was visualized by DAPI. g, h Polysome profiling analysis of TM9SF1 mRNA. The distribution of TM9SF1 mRNA in each fraction of control and PCIF1-depleted BGC-823 cells was determined by qRT-PCR. i Analysis of TM9SF1 mRNA distribution in the fractions of non-polysome and polysome from BGC-823 cells with the indicated siRNA and plasmids. j Western blot analysis of TM9SF1 in AGS cells with the indicated shRNA and plasmids. Data are shown as means ± SD. N.S. not significant; *P < 0.05, **P < 0.01, Student’s t-test.

