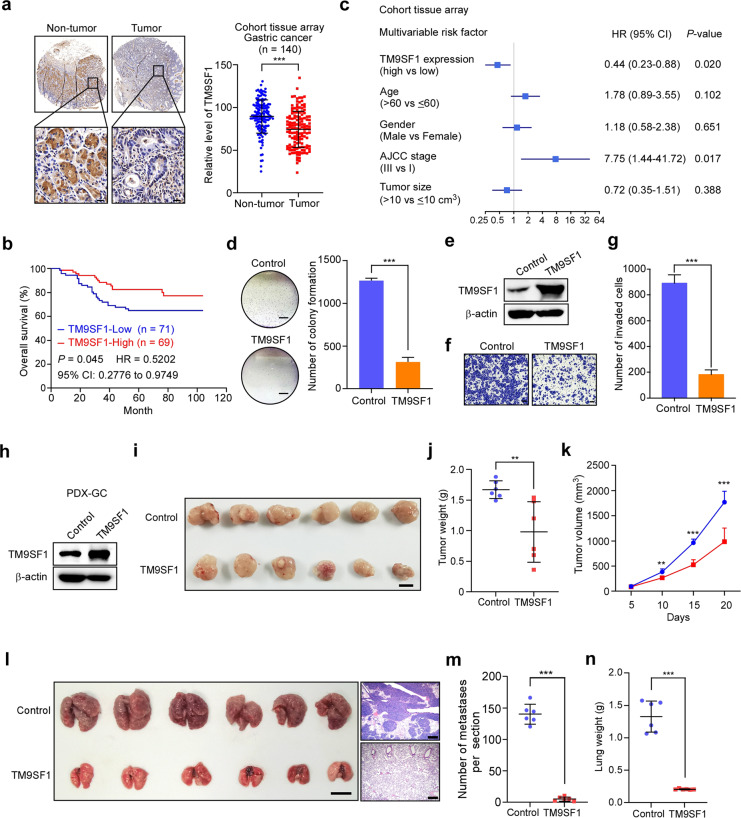
Fig. 5. TM9SF1 functions as a tumor suppressor gene in gastric cancer.
a Immunohistochemistry analysis of gastric cancer tissue array probed with anti-TM9SF1 antibody. Representative images from gastric cancer tissues and their pair non-tumor tissues are presented. Immunohistochemistry scores were analyzed. Bars, 20 μm. b Kaplan–Meier survival curves of TM9SF1 protein expression in gastric cancer tissues from cohort tissue array with best cutoff. c Multivariable risk factor analyses of cohort tissue array. All the bars correspond to 95% CI. HR hazard rate. d Colony formation assays of BGC-823 cells infected with control or TM9SF1 expression lentivirus. Representative images of cell colonies are shown. The colonies were quantified. Scale bars, 5 mm. e Confirmation of TM9SF1 overexpression in BGC-823 cells with control or TM9SF1 expression lentivirus by western blot analysis. f, g Migration analysis of BGC-823 cells infected with control or TM9SF1 expression lentivirus. Representative images of invaded cells are presented (f). The invaded cells were counted (g). Scale bars, 100 μm. h–k PDX-GC cells infected with control or TM9SF1 expression lentivirus were subcutaneously injected into BALB/C nude mice. The expression of TM9SF1 protein was determined by western blotting (h). The images of tumors in each group are shown (i). The average weight of tumors in each group was also analyzed (j). The tumor volume was measured every 5 days, and the growth curves were generated (k). Scale bar, 1 cm. l–n PDX-GC cells were overexpressed with TM9SF1 and intravenously injected into SCID mice. Gross lungs (Scale bars, 1 cm) and representative H&E images (Scale bars, 400 μm) are presented (l). Statistics analyses of pulmonary metastases (m) and lung weight (n) are shown. Data are expressed as means ± SD. **P < 0.01, ***P < 0.001, paired t-test (a), Mann–Whitney test (j, m, n), Student’s t-test (d, g, k).

