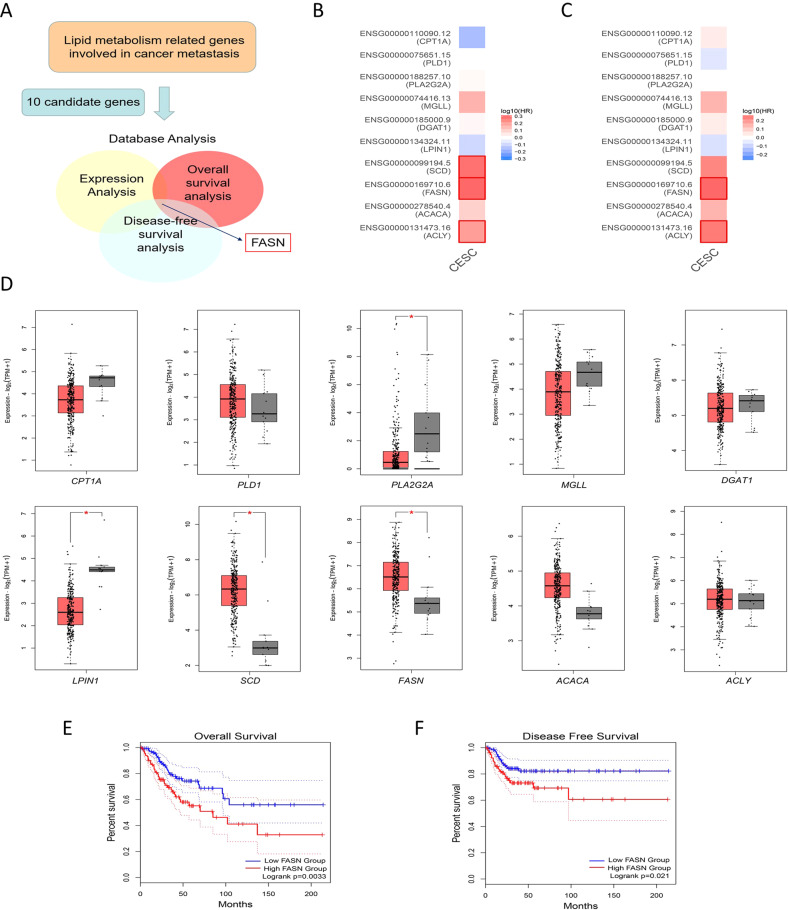
Fig. 1. Identification of FASN in CC based on TCGA dataset analysis.
A Detailed screening workflow using TCGA database to identify FASN. B The overall survival map of 10 lipid metabolism-related genes involved in cancer metastasis. The red border indicates the genes with significant P values. C The disease-free survival map of the same genes in B. The red border indicates the genes with significant P values. D Expression analysis in CC and normal cervical samples in TCGA and GTEx datasets. The red box represents the CC group (n = 306), while the gray box shows the normal tissue samples (n = 13). E Overall survival analysis based on FASN expression level in TCGA database. F Disease-free survival analysis based on FASN expression level in TCGA database. *P < 0.05; **P < 0.01; ***P < 0.001.

