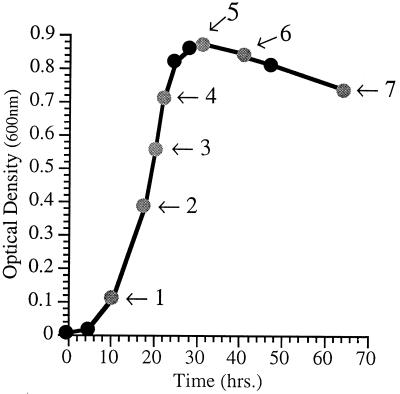
FIG. 1.
Dependence of cellular fatty acid composition in P. profundum DB110 on phase of growth. Shown is the growth curve for DB110 at 15°C and 0.1 MPa in 2216 marine medium. Arrows denote times at which cells were harvested for fatty acid analysis (see Table 3 for corresponding fatty acid profiles).

