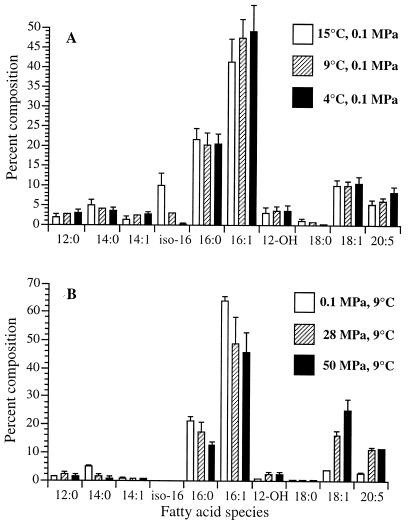
FIG. 2.
Effect of growth temperature (A) and growth pressure (B) on cellular fatty acid composition in P. profundum DB110 (1 MPa = 10 bar ≈ 9.87 atm). Data represents mean percentages (by weight) of fatty acid species, ± standard deviations, derived from triplicate samples harvested in the late exponential phase of growth. See Materials and Methods for cultivation conditions.

