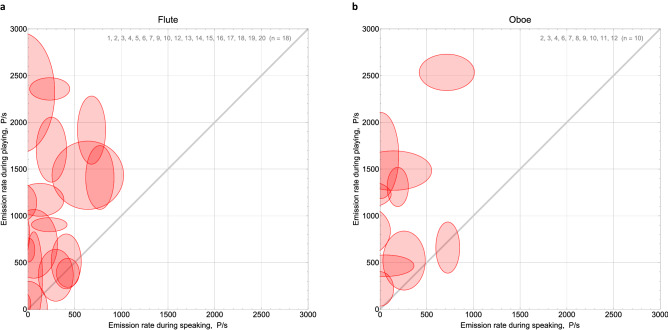
Figure 5.
Aerosol emission rates (unit: particles/s) are displayed for the tasks wind instrument playing (a) flute, (b) oboe, and speaking. The centre point of the ellipse indicates the emission rate from instrument playing on the ordinate and from speaking on the abscissa. The semiaxes of the ellipse indicate the standard deviations of estimation uncertainty for each task, according to bootstrap calculation. The grey lines indicate equal emission rates during both tasks. Ellipses above that line indicate higher emission rates from wind instrument playing than from speaking. The ellipses indicate credibility regions, opacity indicates likelihood.

