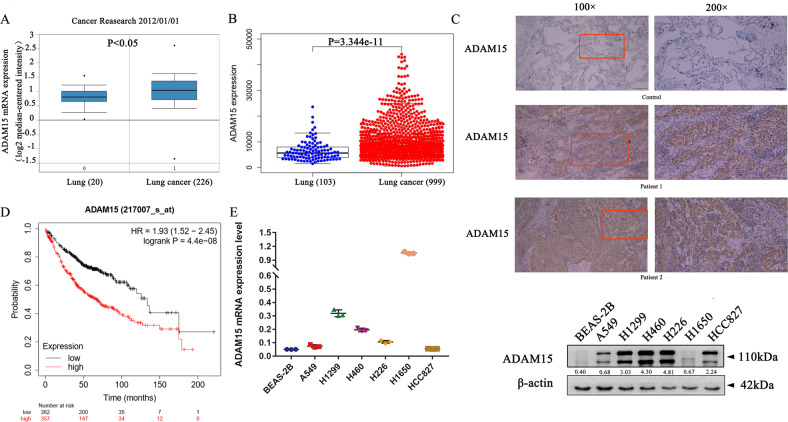
Fig. 1. ADAM15 expression is upregulated in NSCLC cell lines.
A, B Data obtained from the Oncomine database (http://www.oncomine.org) were analysed to compare the ADAM15 levels in 20 normal and 226 lung cancer tissues, and data obtained from TCGA database were analysed to compare the ADAM15 mRNA levels in 103 normal and 999 lung cancer tissues (https://portal.gdc.cancer.gov/). C NSCLC samples were immunostained with an anti-ADAM15 antibody. D Kaplan-Meier analysis of overall survival for ADAM15 expression in 719 adenocarcinoma samples. Kaplan–Meier plots were generated using Kaplan–Meier Plotter (http://www.kmplot.com). E qRT-PCR and western blot analyses of ADAM15 mRNA and protein levels in different non-small-cell lung cancer cells.

