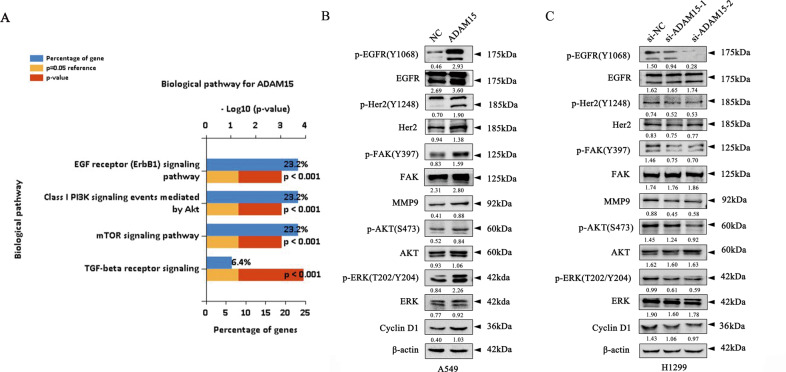
Fig. 3. ADAM15 affects the EGFR-FAK signalling pathways in ADAM15-overexpressing A549 cell lines and ADAM15-knockdown H1299 cell lines.
A Data from TCGA database and analysed by FunRich software (version 3.1.3). B, C Various protein mRNA and protein expression levels were measured by western blot analysis in ADAM15-overexpressing A549 cell lines and ADAM15-knockdown H1299 cell lines. β-actin was used as a loading control. *P < 0.05; **P < 0.01; ***P < 0.001.

