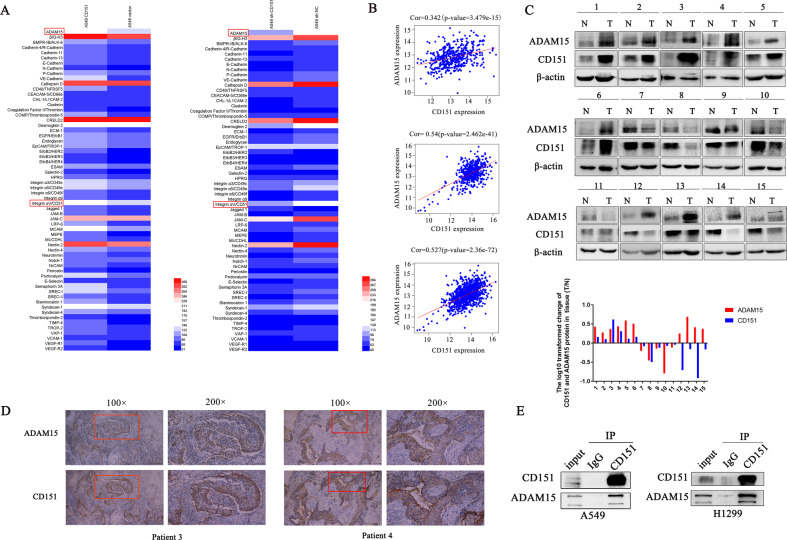
Fig. 6. ADAM15 and CD151 co-expression in NSCLC.
A Hierarchical cluster analysis of microarray data (heat map) was performed to show differentially expressed proteins of A549 cells in different groups. Red and blue indicate high and low protein expression levels, respectively. B Data obtained from TCGA database (https://portal.gdc.cancer.gov/) were analysed to detect the correlation between ADAM15 and CD151 mRNA levels in lung adenocarcinoma, lung squamous cell carcinoma and total lung cancer cell lines. C Western blot analysis of the ADAM15 and CD151 protein levels in 15 randomly selected NSCLC tissues and paired noncancerous lung tissues. D NSCLC samples were co-immunostained with an anti-CD151 antibody and anti-ADAM15 antibody. E Co-immunoprecipitation of ADAM15 and CD151 is shown. Protein was immunoprecipitated and detected from parental A549 and H1299 cells using a specific monoclonal antibody. Bars represent the mean ± SEM from three independent experiments. *P < 0.05; **P < 0.01; ***P < 0.001.

