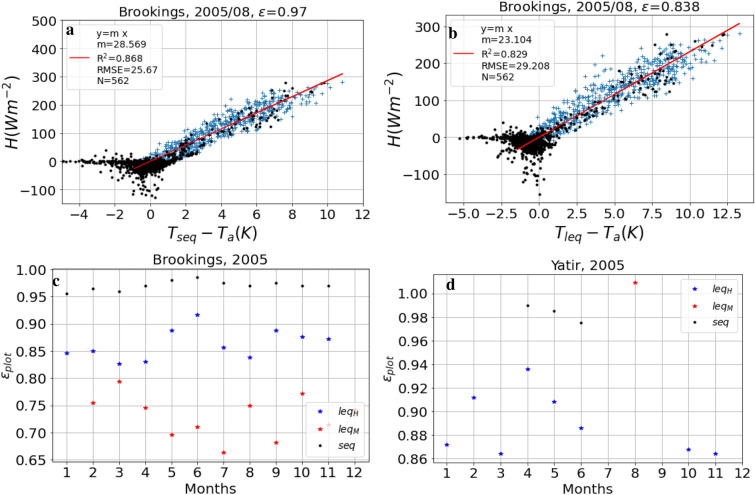
Figure 1.
Reproduction of analysis presented in Figs. 2a, 3C, and Q in Holmes et al.10. (a) Sensible heat (H) vs. based on the short equation [, Eq. (10)]; (b) H vs. based on the long equation (, Eq. 6). Both show data for August 2005 at Brookings. Blue crosses represent data points satisfying the filtering criteria, while black dots represent points not considered in the analysis. N is the number of blue crosses used for regression (red line), m is the slope of regression, RMSE is the root mean square error and R is the square of the coefficient of determination. The fitted value is reported in the title. (c) Optimised values at Brookings obtained for the months where using the short equation (Eq. 9, black dots) and long equation (Eq. 6, blue stars), and obtained using the approach of Maes et al.11 (red stars). (d) Same as (c), but for Yatir Forest, see Table 2 for site descriptions.

