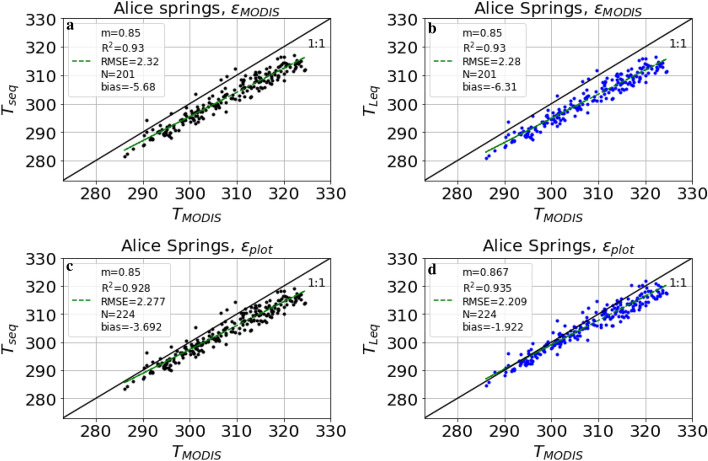
Figure 3.
Landscape-scale LST ( derived from MOD11A1) vs. plot-scale LST at Alice Springs for 2016–2018. (a) based on short equation (Eq. 10) and satellite-derived (MODIS) broadband emissivity; (b) Same as (a), but based on long equation (Eq. 6); (c) based on short equation (Eq. 10) and monthly plot-scale emissivity; (d) Same as (c), but based on long equation (Eq. 6). Bias is mean , N is the number of daily overpasses of MODIS between 2016 and 2018, c is the intercept, m the slope, RMSE is the root mean square error and is the coefficient of determination. At each site, LST was estimated using both the short equation (, Eq. 10) and the long equation (, Eq. 6). In a first step, we used satellite-derived landscape-scale broadband emissivity from MODIS (, Eq. 12) for estimating plot-scale LST from tower-based longwave measurements, and compared these with landscape-scale LST extracted from MODIS LST dataset ().

