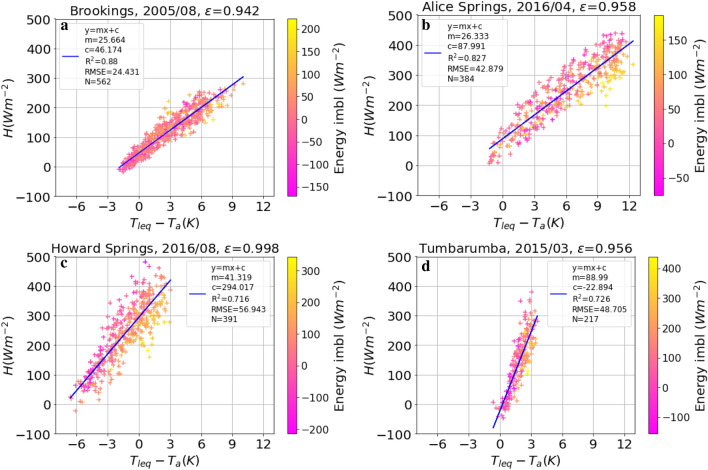
Figure 4.
Sensible heat flux as a function of surface-to-air temperature difference based on Eq. (8) (). was fitted to minimise RMSE of a robust linear regression. The title of the plot contains site, year, month and the fitted -value. The legend correspond to Fig. 1. The colour code indicates the degree of energy imbalance of each data point (i.e. ). The panels (a) to (d) refer to the same analysis at different sites, as indicated in the title of each panel.

