
Fig. 1.
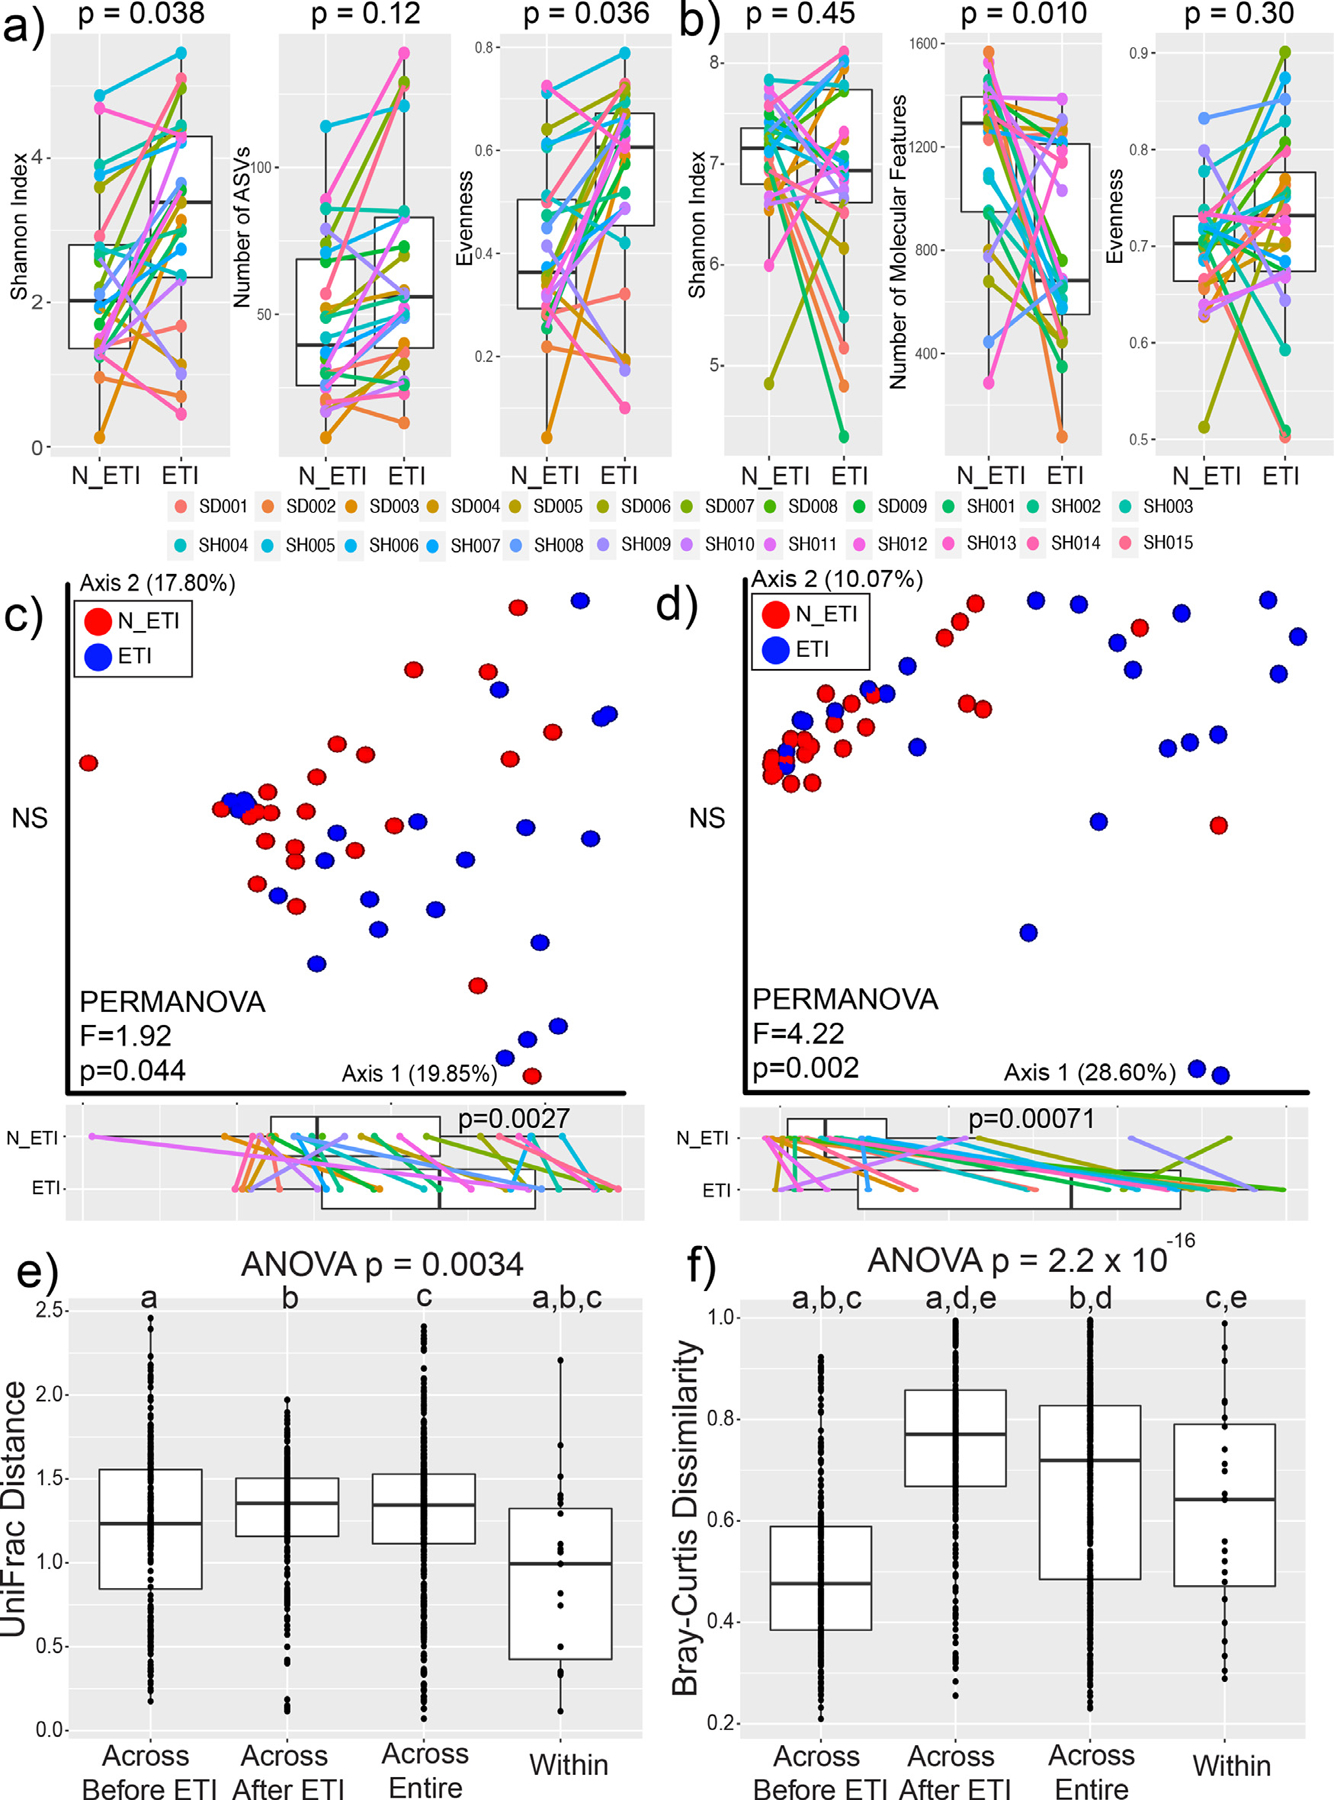
Alpha and Beta-diversity of lung microbiomes before and after ETI. Alpha-diversity measures of a) microbiome data and b) metabolome data before (N_ETI) and after ETI therapy. P-values shown are from either the DM t-test or WSRT after testing for normality. Principal coordinate analysis plots of beta-diversity data for c) microbiome data with significance calculated utilizing the weighted UniFrac distance and d) metabolome data with significance calculated utilizing the Bray-Curtis distance. PERMANOVA statistics and the percent of variance explained by each axis are shown. Boxplots of positions on the first principal coordinate are shown tested for significance with the DM t-test. Beta-diversity cross comparisons within the e) microbiome and f) metabolome data. Cross comparisons were done across subjects before and after ETI therapy, across the entire dataset, and within a subject’s paired samples (within). Statistical significance was first tested with an ANOVA followed by an ad-hoc Tukey’s test. Shared letters denote distributions that are significantly different from each other.