Fig. 5.

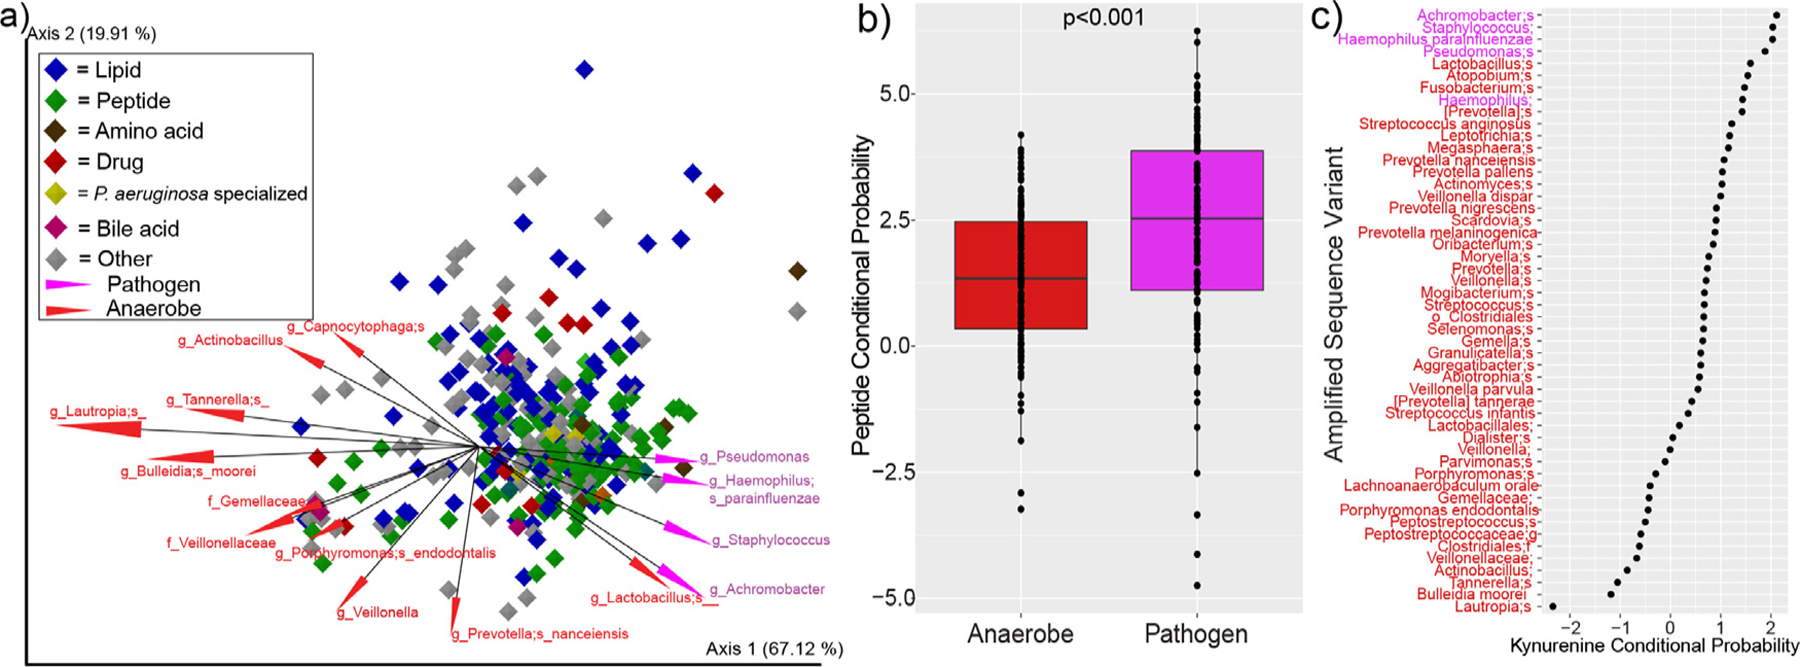
Mmvec analysis of sputum microbiomes and metabolomes from pwCF. a) Biplot of the metabolite and microbe vector associations. Each diamond represents a metabolite (only metabolites annotated within the GNPS library are shown) and they are colored by their molecular family. The vectors are the top 15 ASVs associated with the metabolomic dynamics and they are colored by whether or not they are considered clinical pathogens or anaerobes. b) Conditional probability distributions for the mean of all peptides identified in the dataset and their association with either anaerobes (red) or pathogens (purple, p-value from DM T-test). c) Rank abundance of the conditional probabilities of kynurenine with different anaerobes (red) and pathogens (purple) ASVs.
