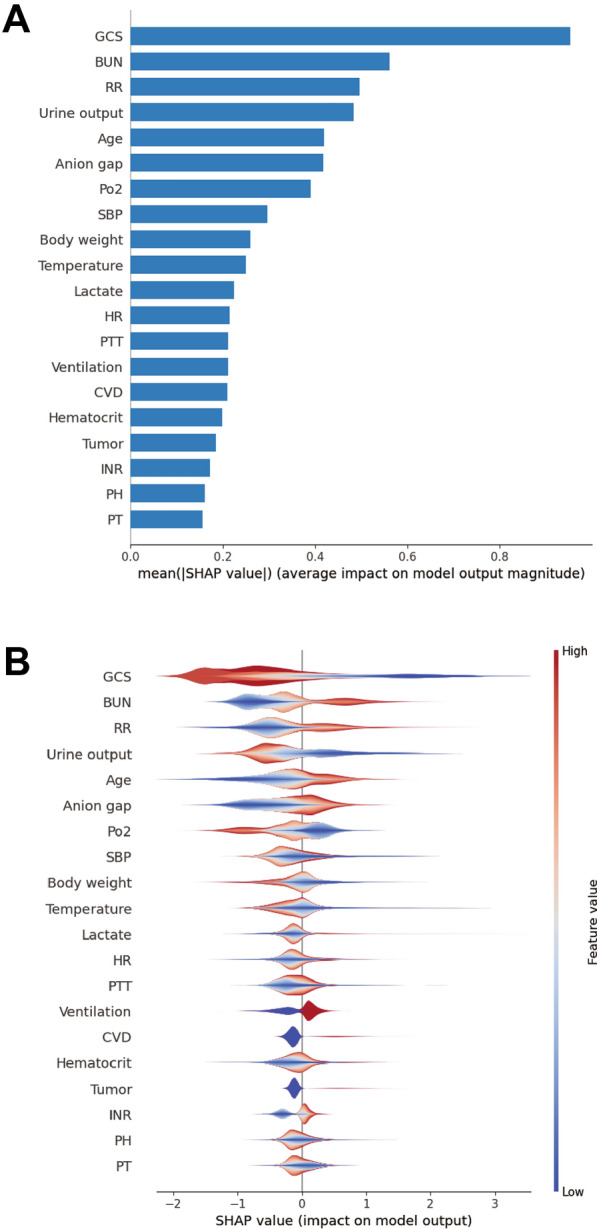
Fig. 3.

SHAP summary plot for the top 20 clinical features contributing to the XGBoost model. A SHAP feature importance measured as the mean absolute Shapley values. This matrix plot depicts the importance of each covariate in the development of the final predictive model. B The attributes of the features in the model. The position on the y-axis is determined by the feature and on the x-axis by the Shapley value. The color represents the value of the feature from low to high. SHAP SHapley Additive explanation, XGBoost eXtreme Gradient Boosting. GCS Glasgow Coma Scale, BUN blood urea nitrogen, RR respiratory rate, HR heart rate, PTT partial thromboplastin time, CVD cerebrovascular disease, MAP mean arterial pressure, WBC white blood cell, PT prothrombin time
