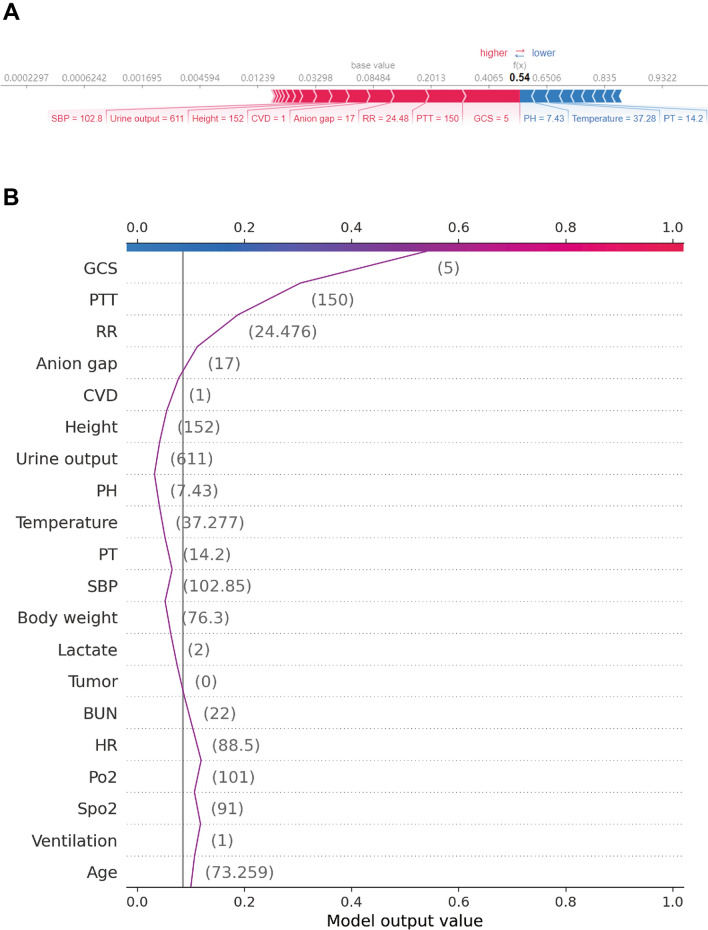
Fig. 5.
SHAP force plot for explaining of individual’s prediction results in the validation cohort. Screenshot of the death prediction in patients with sepsis. A, B Model predictions by randomly drawing a single sample from the validation cohort. Redder sample points indicate that the value of the feature is larger, and bluer sample points indicate that the value of the feature is smaller. GCS Glasgow Coma Scale, BUN blood urea nitrogen, RR respiratory rate, CVD cerebrovascular disease

