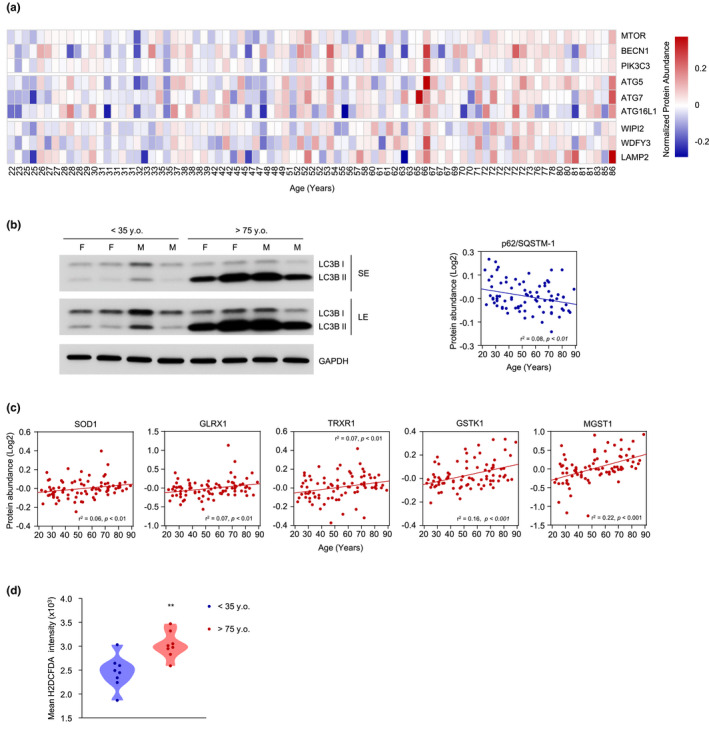
FIGURE 3.

Higher levels of proteins implicated in autophagy and detoxification with age and assessment of the respective pathways. (a) Heatmap of autophagy‐related proteins in each of the 82 donors (columns). Donor ages are indicated at the bottom. (b) Western blot analysis of LC3‐I and LC3‐II in 4 donors <35 years old and 4 donors >75 years old, including both female (F) and male (M) donors. GAPDH levels were included to monitor loading (left). Graph, linear regression analysis of p62/SQSTM1 levels from the proteomic analysis (right). (c) Linear regression graphs of significantly overrepresented proteins associated with ROS scavenging. (d) Accumulation of ROS in 8 donors <35 years old and 8 donors >75 years old as assessed by flow cytometry (Materials and Methods). Mean intensity of FITC (H2DCFDA). BECN1, Beclin‐1; PIK3C3, class III phosphatidylinositol 3‐kinase; GLRX1, glutaredoxin 1; GSTK1, glutathione S‐transferase kappa 1; LAMP2, lysosome‐associated membrane protein 2; LE, long exposure; MGST1, microsomal glutathione S‐transferase; mTOR, mechanistic target of rapamycin; SE, short exposure; SOD1, CuZn‐superoxide dismutase, CuZn‐SOD; SQSTM1, p62/Sequestosome‐1; TRXR1, thioredoxin, reductase 1; WDFY3, WD repeat and FYVE domain‐containing protein 3; WIPI2, WD repeat domain phosphoinositide‐interacting 2. Significance was established using Student's t test. **p ≤ 0.01
