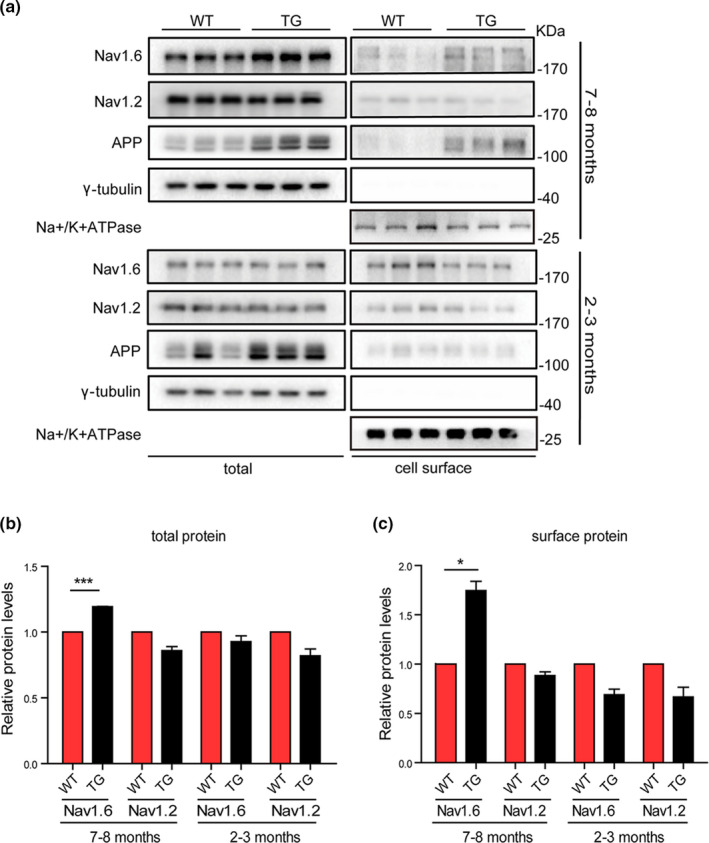
FIGURE 1.

Expression levels of total and cell surface levels of Nav1.6/Nav1.2/APP in APP/PS1 mice brain. Representative immunoblots (a) and densitometry analysis of the total (b) and cell surface (c) protein expression levels of Nav1.6, Nav1.2. APP levels in the brain of APP/PS1 and WT mice at different ages (2–3 months and 7–8 months). Here, Nav1.6, Nav1.2, APP, and their corresponding γ‐tubulin immunoblots was performed on different parts of the PVDF membrane of different gels. Data were presented as mean ± SEM, *p < 0.05, and ***p < 0.001
