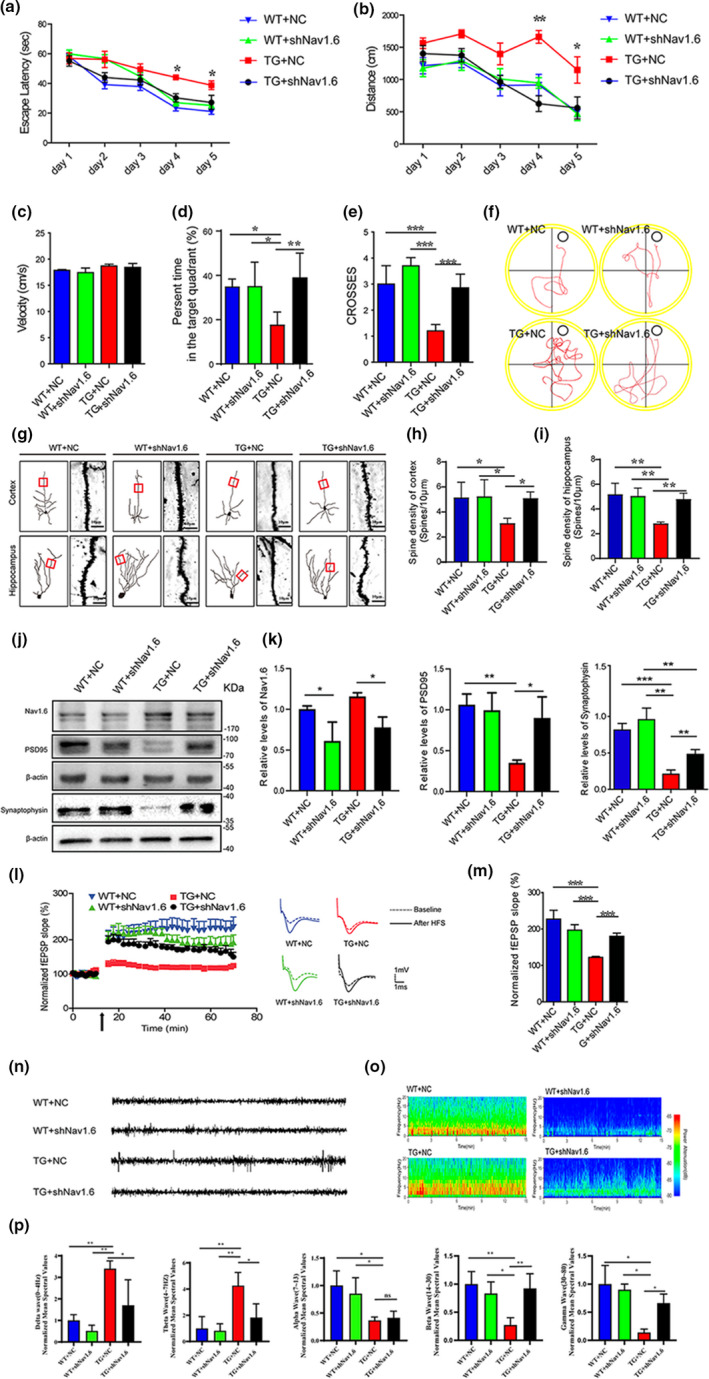
FIGURE 2.

Nav1.6 knockdown attenuates cognitive deficits, ameliorates suppressed synaptic plasticity, and reduces hyperexcitability in APP/PS1 mice. (a–f) Acquisition of spatial learning in the different groups of mice after injecting with siNav1.6 and NC in the MWM with the hidden platform. (a) Escape latencies were measured for the APP/PS1 (TG) and wild‐type (WT) mice treated with either shNav1.6 or NC. (b) The average distance traveled by mice on the different trial days. (c) The swimming speed of the four groups of mice throughout the trial days. (d) The duration of stay in the target quadrant for four groups of mice. (e) The number of times that the four groups of mice swam across the target site after removal of the platform. (f) Representative images of the track visualization path that the mice would swim to find the platform. Data are presented as the mean ± SEM. *p < 0.05; **p < 0.01, ***p < 0.001. n = 7–9 mice/group. (g) Representative micrographs of dendritic spines in the four groups of mice (n = 5 mice/group; scale bar: 10 μm). (h, i) Bar graph showing the number of dendritic spines per unit micrometer (µm) in the cortex and hippocampus of four groups of mice. (j) Representative immunoblots and (k) densitometry analysis of synaptic protein (synaptophysin, PSD95) expression level in the four groups of mice. Here, synaptophysin and its corresponding β‐actin immunoblots were performed on different parts of PVDF membrane of the same gels (n = 8–10 mice/group). (l) Time course data on of the effects of HFS on the fEPSP initial slope. (m) Cumulative data showing the mean fEPSP slope 60 min post‐HFS (n = 5 mice/group, 3–4 slices per mice). (n) Representative traces of EEGs for the four groups of mice showing paroxysmal sinusoidal discharges in TG + NC and Nav1.6 knockdown reduced the paroxysmal sinusoidal discharges in TG + shNav1.6 mice. (o) Representative spectrograms of EEG for the four groups of mice. (p) Normalized differential band spectrum showed significant effects in delta, theta, beta, alpha, and gamma waves in the four groups of mice. Data are presented as the mean ± SEM. **p < 0.01; ***p < 0.001
