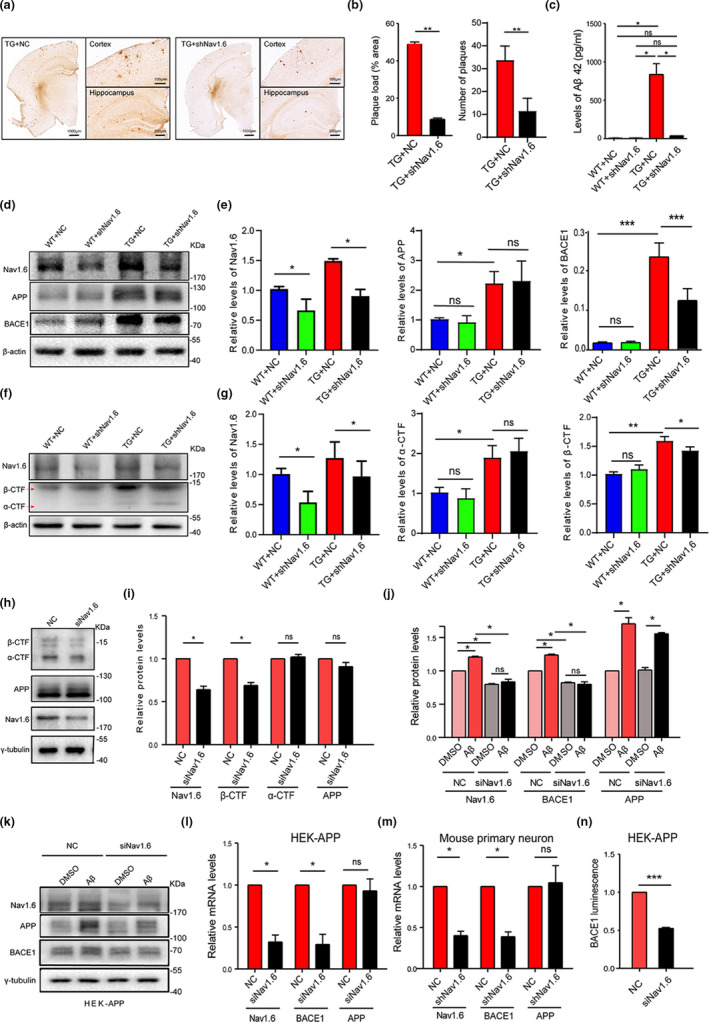
FIGURE 3.

Nav1.6 knockdown inhibits the accumulation of Aβ and the cleavage of APP by β‐secretase by suppressing transcription of BACE1. (a) Coronal sections of the hippocampus were immunohistochemically stained with an antibody against Aβ. (b) The size and number of Aβ plaques were quantified in APP/PS1 treated with siNav1.6 and NC (n = 5 mice/group, 3 slices per mice). (c) Protein levels of Aβ42 using ELISA in the four groups of mice (WT and APP/PS1 treated with siNav1.6 or NC); n = 5 mice/group. Representative immunoblots (d) and densitometry analysis (e) of Nav1.6, BACE1, and APP protein expression in the brain of mice (WT and APP/PS1 treated with siNav1.6 or NC), n = 5 mice/group. Representative immunoblots (f) and densitometry analysis (g) of Nav1.6, α‐CTF, and β‐CTF protein expression in mice brain (WT and APP/PS1 treated with siNav1.6 or NC), n = 5 mice/group. Representative immunoblots (h) and densitometry analysis (i) of Nav1.6, β‐CTF, α‐CTF, and APP in HEK‐APP cells after knockdown with siNav1.6. Here, Nav1.6, β‐CTF, α‐CTF, APP, and their corresponding γ‐tubulin immunoblots were performed on different parts of the PVDF membrane of different gels. γ‐tubulin was used as a loading control (n = 4–5 groups). Data are presented as mean ± SEM. *p < 0.05, and **p < 0.01. Representative immunoblot (k) and densitometry analysis (j) of BACE1, APP, and Nav1.6 in the HEK‐APP cell line after treatment with NC and siNav1.6. Relative mRNA expression level of Nav1.6, BACE1, and APP in the HEK‐APP cell line (l) and mouse primary neurons (m) after treatment with NC and siNav1.6/shNav1.6, respectively. The relative expression was normalized to β‐actin. (n) Luminescence density of BACE1 in HEK‐APP cell line using the fluorescein reporter gene detection system after treatment with NC and siNav1.6 (3–5 biological replicates). Here, BACE1 (in the animal model) was normalized to β‐actin, BACE1, APP, and Nav1.6 (in HEK‐APP cell line) were normalized to γ‐tubulin in the Western blots, whereas Nav1.6, BACE1, and APP were normalized to actin in the RT‐PCR. Data are presented as mean ± SEM. *p < 0.05, ***p < 0.001
