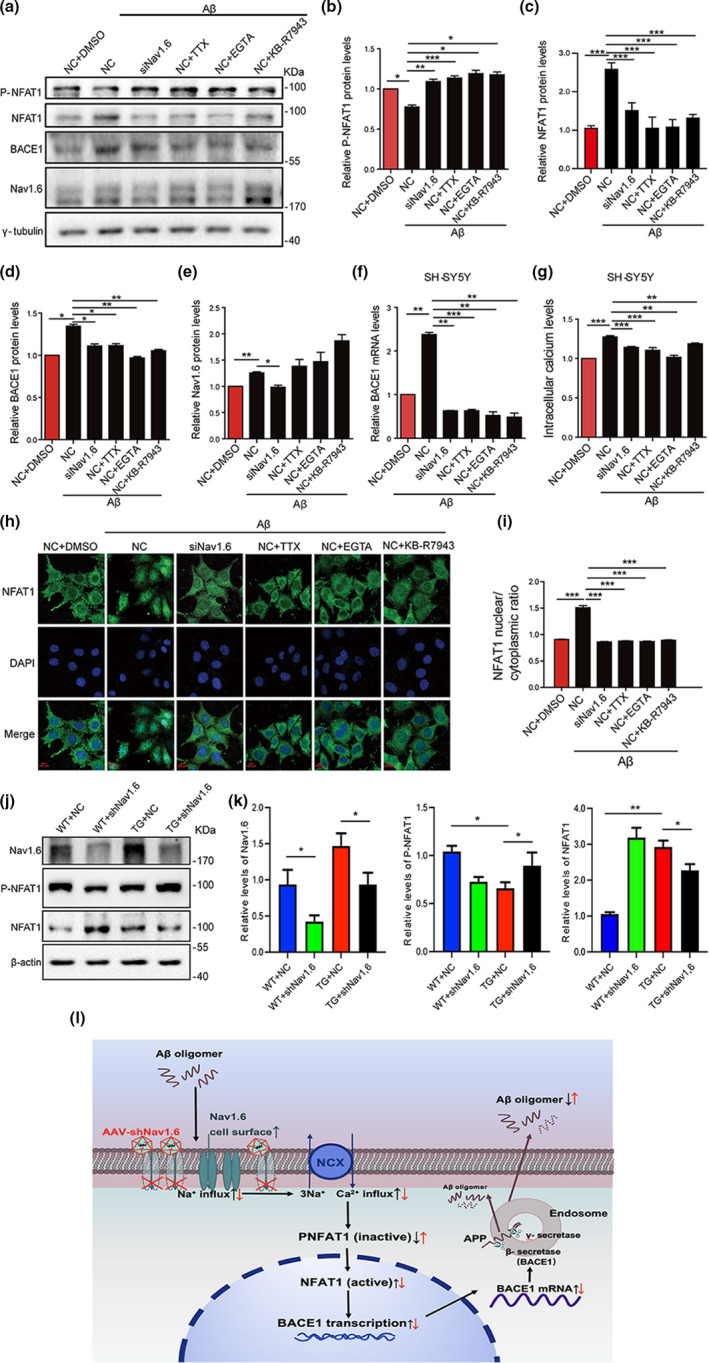
FIGURE 5.

Aβ oligomer‐induced expression levels of BACE1 and inactive NFAT1 by interference with Nav1.6, TTX, EGTA, and KB‐R7943. Representative immunoblots (a) and densitometry analysis of P‐NFAT1 (inactive) (b), NFAT1 (active) (c), BACE1 (d), and Nav1.6 (e) expression levels in SH‐SY5Y cells after treatment with siNav1.6, 1 μM TTX, 0.5 mM EGTA, and 5 μM KB‐R7943 under induced Aβ oligomers condition. (f) Relative mRNA expression of RT‐qPCR showing the expression level of BACE1 in the SH‐SY5Y cells after treatment with siNav1.6, 1 μM TTX, 0.5 mM EGTA, and 5 μM KB‐R7943 under induced Aβ oligomers condition. (g) Intracellular calcium levels in SH‐SY5Y cell after treatment with NC, siNav1.6, 1 μM TTX, 0.5 mM EGTA, and 5 μM KB‐R7943 under induced Aβ oligomers condition. (h) SH‐SY5Y cells were either treated with 1 μM TTX, 0.5 mM EGTA, and 5 μM KB‐R7943 or transfected with Nav1.6 siRNA in the presence of Aβ oligomers and immunostained for NFAT1 and DAPI. Scale bar: 100 μm. (i) The ratio of nuclear NFAT1 to the cytoplasmic NFAT1. Here, P‐NFAT1, BACE1, and Nav1.6 were normalized to γ‐tubulin in the Western blot, whereas BACE1 was normalized to ACTIN in the RT‐PCR. Data are presented as mean ± SEM. *p < 0.05, **p < 0.01, **p < 0.001. Representative immunoblots (j) and densitometry analysis (k) of Nav1.6, P‐NFAT1, and NFAT1 protein expression in the brain of mice (WT and APP/PS1 treated with siNav1.6 or NC), n = 5 mice/group. (l) The proposed flowchart cycle depicting interference of Nav1.6’s effect on the progression of AD. Interference of Nav1.6 can reduce the Aβ oligomers‐dependent transcription of BACE1, which then relieves intracellular calcium overload by inhibiting sodium‐calcium reverse exchange channel and leads to an increase in non‐activated NFAT1 expression levels. The reduced transcription of BACE1, in turn, decreases Aβ production and slows the progression of AD
