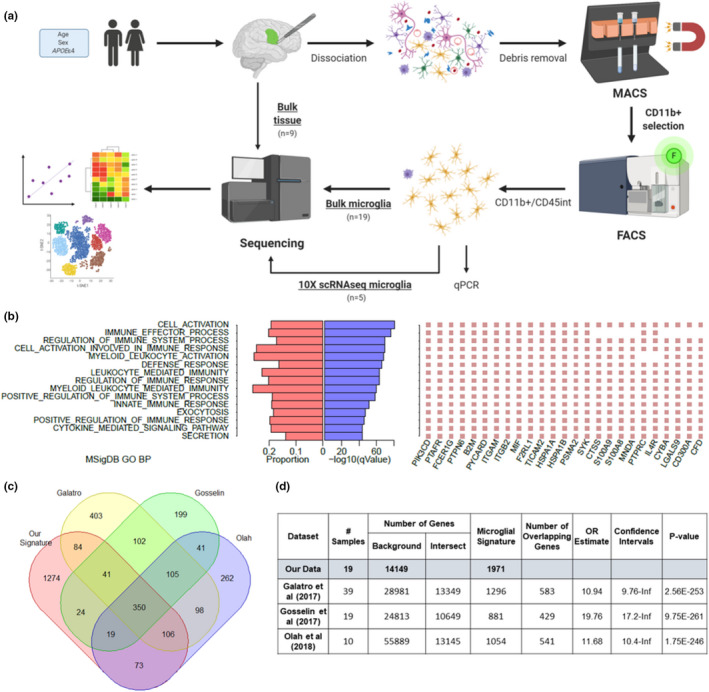
FIGURE 1.

Characterization of our core human microglial signature. (a) Schematic illustrating our experimental approach for isolating microglial populations from fresh brain tissue and data analyses. [Created with BioRender.com] (b) MSigDB GO terms enriched in our microglial signature genes and top 25 genes for each. (c) Venn diagram showing number of overlapping genes between our microglial signature and those previously reported from Galatro et al. (2017), Gosselin et al. (2017) and Olah et al. (2018). (d) Hypergeometric tests of overrepresentation showing overlap with the published signatures
