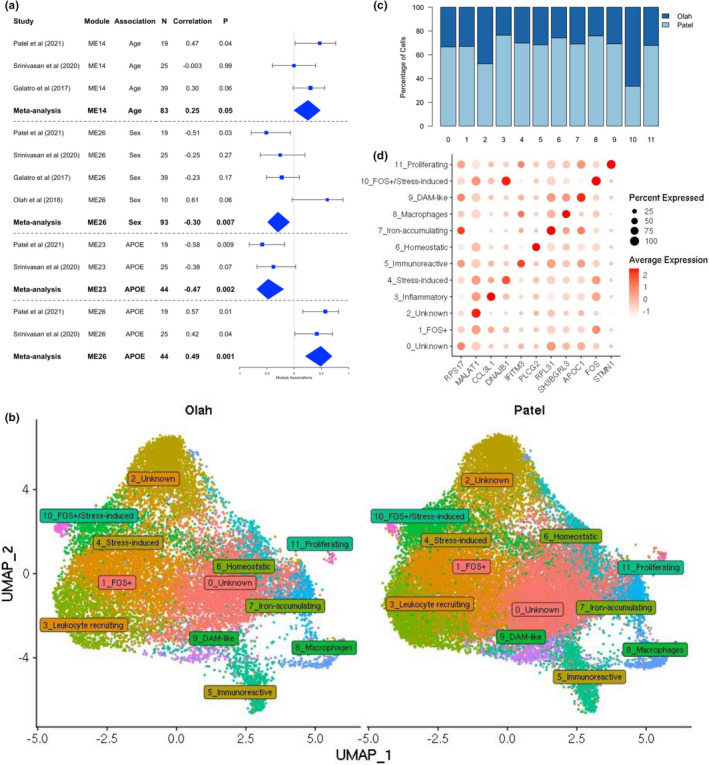
FIGURE 4.

Meta‐analysis with published datasets. (a) Forest plots of module eigengene correlations across datasets and meta‐analyzed. (b) Integrated UMAP of our and Olah et al. (2020) single‐cell data, split by dataset. (c) Stacked bar plot showing the distribution of cells across the clusters. (d) Dot plot showing the expression of key significant module genes across clusters
