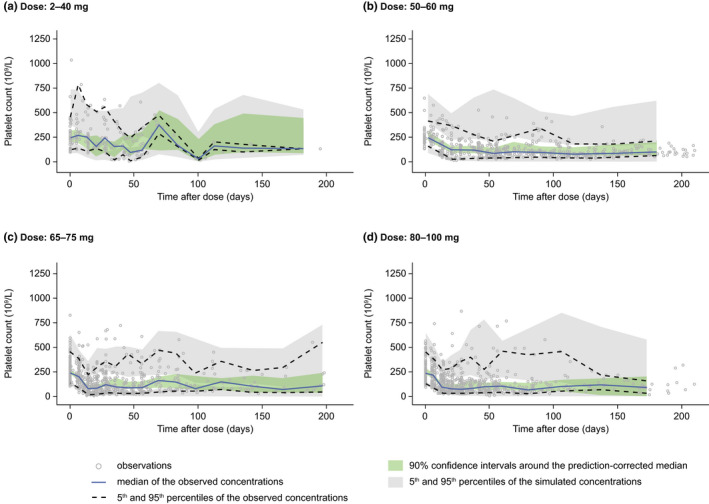
FIGURE 2.

Visual predictive checks for the final platelet model simulated versus observed data by dose of molibresib: (a) 2–40 mg, (b) 50–60 mg, (c) 65–75 mg, and (d) 80–100 mg. All observations and predictions were adjusted using prediction correction 25
