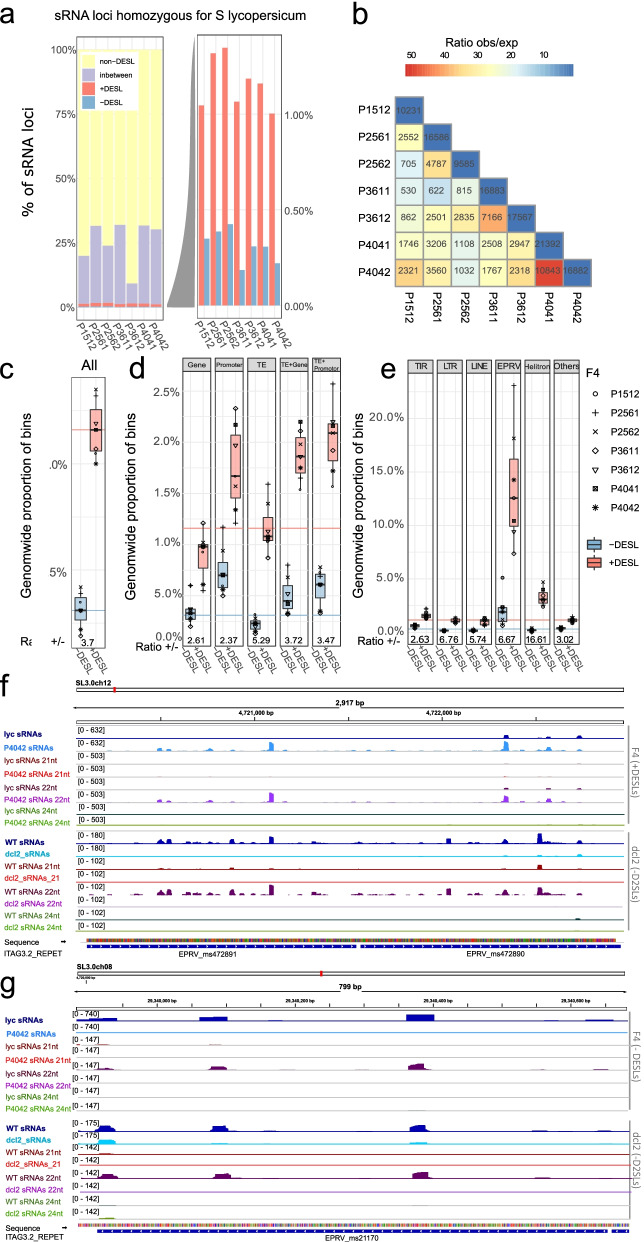
Fig. 2.
sRNA analysis of lyc homozygous transcribed regions in hybrids: a S. lycopersicum genome is divided into 200-nt bins (sRNA loci). Percentage of sRNA loci in each group (F4s vs lyc parent) calculated from the total number of sRNA loci in lyc homozygous transcribed regions. Groups are sRNA loci upregulated (+ DESL, red), downregulated (− DESL, blue), “in-between” (lilac), and non-differentially expressed (non-DESL, yellow). The right-hand panel shows an expanded view of the + DESL (red) and − DESL (blue). Thresholds: DESL, FDR < 0.05; “in-between,” 0.05 < FDR < 0.9; non-DESL, FDR > 0.9. b Overlap matrix showing the number of lyc DESL shared among the F4 hybrids. The color scale shows the ratio of observed vs expected sRNA loci shared in a pairwise combination. c–e Box plot showing the percentage of lyc sRNA loci that map c genome-wide, d to each genomic feature, e to TE order that are + DESL or − DESL. The ratio of + DESL/ − DESL is shown at the bottom. Each plant is represented by different symbols. Box plot elements: box limits, upper and lower quartiles; center line, median; whiskers, from each quartile to the minimum or maximum. For comparison, colored lines are the genome percentage values for + DESL (red) and − DESL (blue) (from c). f, g Genome browser snapshots of two genomic regions with f sRNA loci upregulated in the F4 and downregulated in dcl2 (+ DESL/ − D2SL) and g sRNA loci downregulated in the F4 and dcl2 (− DESL/ − D2SL). Tracks show sRNA mapping (blue) and filtered for 21 nt (red), 22 nt (purple), and 24 nt (green) for lyc and P4042 (top tracks) and WT and dcl2 (bottom tracks). The numbers in brackets show the scale (normalized number of reads) for each track. The P4042 data are from this paper and dcl2 raw data from [18]

