Fig. 4.
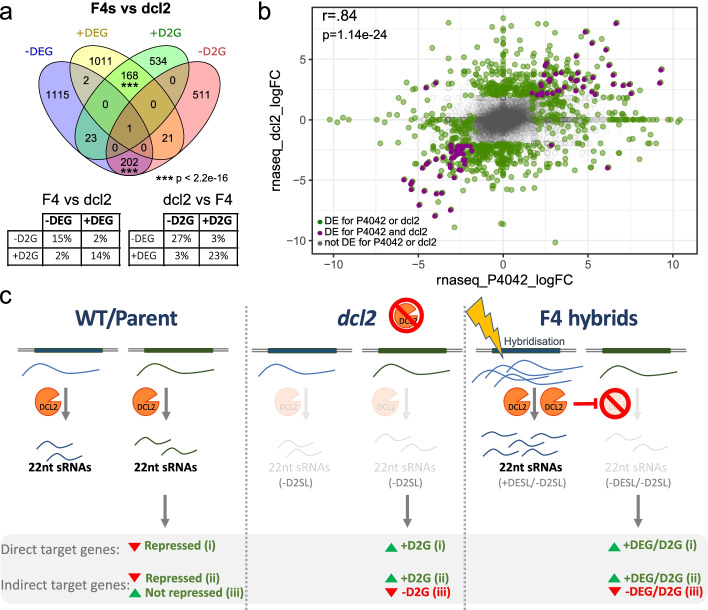
Common response in the change of gene expression in the F4 hybrids and dcl2 mutant. a Venn diagram of the consolidated DEG for the F4s (compilation of + / − DEGs in at least one F4 plant) compared to differentially expressed genes in dcl2 (+ / − D2G). Statistical association determined by Fisher’s exact test*** two-tailed p < 2.2e − 16. Tables showing the percentage of DEGs in the F4 (being 100%) shared with dcl2 (left) and for DE genes in dcl2 (being 100%) shared with F4 (right). b Scatter plot of the fold change (FC) in the gene expression in P4042 vs dcl2. Gray, non-DE; green, DE genes for P4042 or dcl2. Purple: DE genes for both P4042 and dcl2. Pearson correlation coefficient value (r) for DEG and D2G genes (purple genes), p = p-value. c The diagram shows subsets of sRNA loci (SL) that are dependent on DCL2 and + DESL or − DESL depending on whether they are over- or under-expressed in the lyc × pen hybrids. In the WT/parental plants, we envision that sRNAs from these loci cause direct sRNA silencing of target genes (i) or can also have an indirect effect if the target is an activator (ii) or repressor (iii). In the dcl2 mutant, these direct or indirect effects would be reversed because the sRNAs would not be produced. In the lyc × pen hybrid, the wild type/parental silencing effects would also be reversed if the overexpressed + DESL sRNAs are able to compete with the − DESL sRNAs for components of the DCL2 sRNA silencing pathway. Most of these + DESL and DCL2-dependent sRNAs correspond to EPRVs (Fig. 3c)

