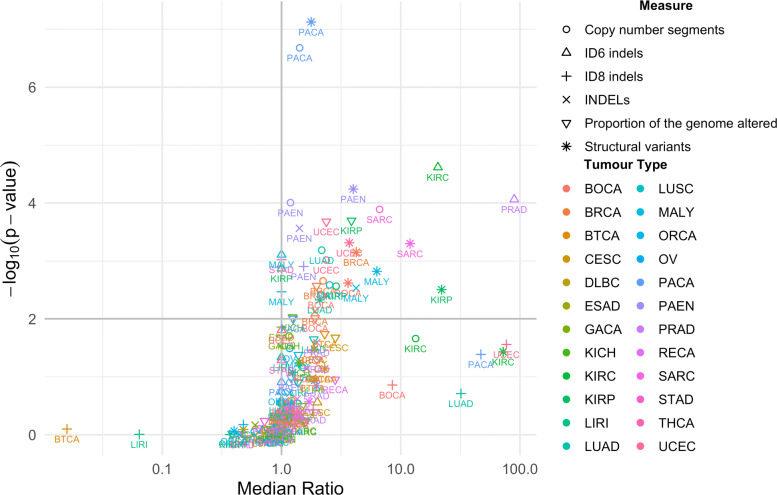
Fig. 3.
The effect of SBS2 and SBS13 presence on genomic instability by tumour type. Ratio of the median value of each measure of genomic instability for tumours containing SBS2 and SBS13 mutation to those that do not contain SBS2 and SBS13 mutations. p values were derived from one-sided Wilcoxon rank sum tests, and the horizontal grey lines indicates an FDR of 0.05, which includes points that fall on the line. The number of samples in which SBS2 and SBS13 mutations are present and absent are reported for each tumour type in Additional file 1: Supplementary Table 1. Details of the means and median ratios, and p values for each of the tumour type and genomic instability measure combinations are presented in Additional file 2: Supplementary Data 1

