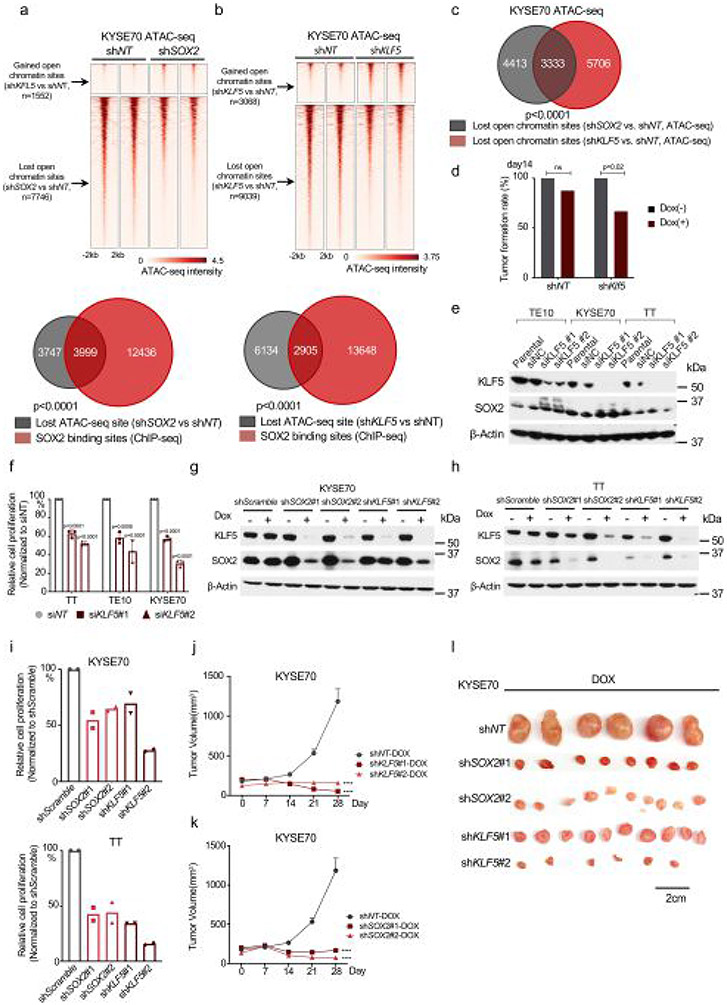
Extended Data Fig. 7 ∣. Klf5 facilitates SOX2 activity and is essential for SOX2 + ESCC.
a, ATAC-seq signal (horizontal window of ±2 kb from the peak center) in open-chromatin sites lost upon shSOX2 in KYSE70 (Top). (Bottom) Overlap of open-chromatin sites lost upon shSOX2 and endogenous SOX2 binding sites in KYSE70 cells. P < 0.0001 by fisher exact test with KYSE70 shSOX2 unchanged chromatin sites as control. b, ATAC-seq signal in open-chromatin sites gained and lost upon shKLF5 in KYSE70 (Top). Two independent biological replicates are shown. (Bottom) overlap of open-chromatin sites lost upon shKLF5 and endogenous SOX2 binding sites in KYSE70. P < 0.0001 by fisher exact test with KYSE70 shKLF5 unchanged chromatin sites as control. c, Overlap of lost ATAC-seq signals after shRNA-mediated SOX2 or KLF5 silencing in KYSE70. P < 0.0001 by two-sided fisher exact test (KYSE70 shKLF5 unchanged sites as control). d, Tumor formation rate of SCPP organoids with or without Klf5 silencing. Each group includes 6–10 tumors. Ns: not significant, p-value by two-sided fisher exact test. e, Immunoblots following siKLF5 in human ESCC cell lines. f, Proliferation TE10, KYSE70 and TT after KLF5 siRNA. Three independent biological replicates were performed for each cell line. Data were normalized to control siRNA and shown as mean ± SD, p-value by one-way ANOVA with Benjamini-Hochberg correction. g, Representative immunoblots of KYSE70 72 hours after shRNA-mediated SOX2 and KLF5 silencing. h, Representative immunoblots of TT 72 hours after shRNA-mediated SOX2 and KLF5 silencing. i, Proliferation of KYSE70 (Top) and TT (Bottom) 72 hours after shRNA-mediated SOX2 and KLF5 silencing. Two biological replicates were performed. j, Growth for KYSE70 xenografts (n = 6–10) with shKLF5. Data are shown as mean ± SEM; ****p < 0.0001 by two-sided two-way ANOVA with Benjamini-Hochberg correction. k, Growth for KYSE70 xenografts (n = 6–10) with shSOX2. Data are shown as mean ± SEM; ****p < 0.0001 by two-sided two-way ANOVA with Benjamini-Hochberg correction. l, Tumor volume of KYSE70 with noted inducible shRNA. Representative images of tumors from panel. Scale bar is 2 cm. 6–10 tumors per group.

