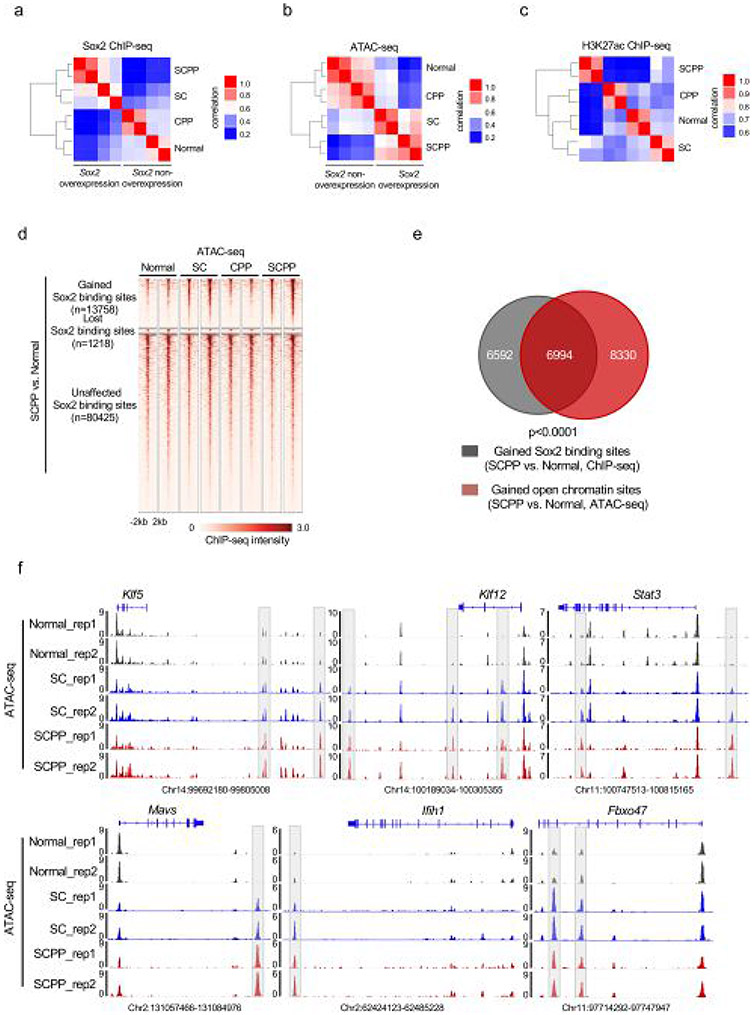
Extended Data Fig. 2 ∣. Genomic occupancy of Sox2 changes from normal to neoplastic organoids.
a, Pairwise Spearman correlation of Sox2 ChIP-seq between the Sox2 overexpression and non-overexpression organoids. Unsupervised hierarchical clustering showed the relatedness of each sample. Two independent biological replicates were performed and shown for each organoid. b, Pairwise Spearman correlation of ATAC-seq between the Sox2 overexpression and non-overexpression organoids. Unsupervised hierarchical clustering shows the correlation for each pairs of the biological replicates. Two independent biological replicates were performed and shown for each organoid. c, Pairwise Spearman correlation of H3K27ac ChIP-seq between the Sox2 overexpression and non-overexpression organoids. Unsupervised hierarchical clustering showed the correlation between each sample pair from the same organoid. Two independent biological replicates were performed and shown for each organoid. d, Heatmaps of ATAC-seq signals ±2 kb around Sox2 peaks (identified in Fig. 2a) across different organoids. Two independent biological replicates were performed and shown for each organoid. e, Venn Diagram shows the overlap of Sox2 sites that are gained in SCPP (vs. Normal) and open chromatin sites in SCPP (vs. Normal), as defined by ATAC-seq signal. P < 0.0001 calculated by two-sided fisher exact test (SCPP vs. Normal (unchanged chromatin sites as control). f, Representative ATAC-seq tracks, showing increased chromatin accessibility at Klf5, Klf12, Stat3, Mavs, Ifih1 and Fbxo47 locus in normal, SC and SCPP organoids.

