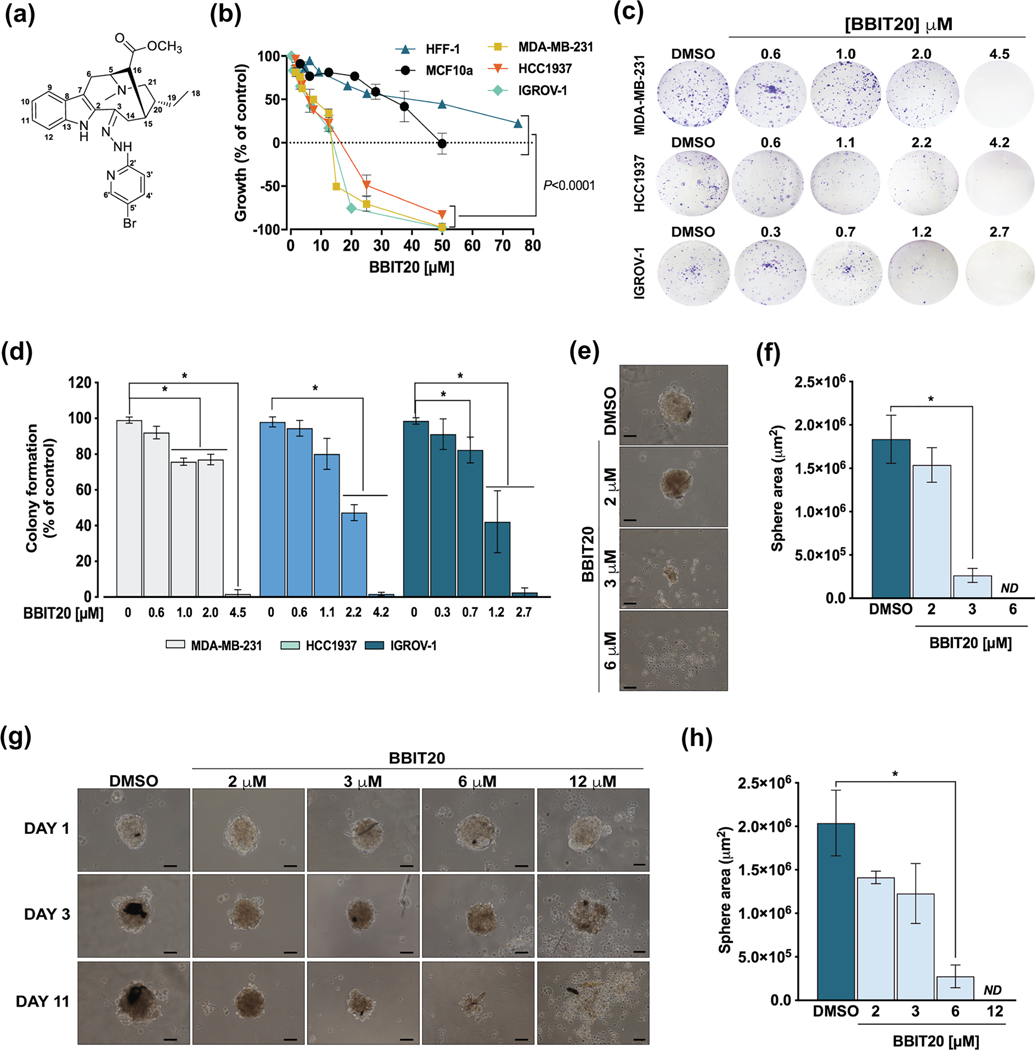
FIGURE 1.
Growth inhibitory effect of BBIT20 on 2D and 3D models of human triple-negative breast and ovarian cancer cells. (a) Chemical structure of BBIT20. (b) Dose–response curves for the growth inhibitory effect of BBIT20 on human non-malignant (MCF10a and HFF-1), triple-negative breast cancer (MDA-MB-231, HCC1937) and ovarian cancer (IGROV-1) cells, after 48 h of treatment; growth obtained with control was set as 100%; data are mean ± SD, n = 5 independent experiments (two replicates each); values obtained for non-malignant cells are significantly different from cancer cells: *P <0.05 (one-way ANOVA followed by Dunnett’s test). (c, d) Effect of BBIT20 on colony formation of cancer cells after 8 (MDA-MB-231 and IGROV-1) and 16 (HCC1937) days of treatment. In (c), representative experiments are shown. In (d), quantification of colony formation; growth obtained with DMSO was set as 100%; data are mean ± SD, n = 5 independent experiments; *P <0.05, significantly different from DMSO (two-way ANOVA followed by Sidak’s test). (e, f) Evaluation of HCC1937 mammosphere formation after 72 h of treatment with BBIT20; treatment was performed at seeding time of HCC1937 cells. (g, h) Effect of BBIT20 on 3-day-old HCC1937 mammospheres, for up to 11 days treatment. In (e) and (g), representative images are shown (scale bar = 50 μm, 100X magnification). In (f) and (h), determination of mammosphere area at the end of treatment; data are mean ± SD, n = 5 independent experiments; *P <0.05 significantly different from DMSO (unpaired Student’s t-test)

